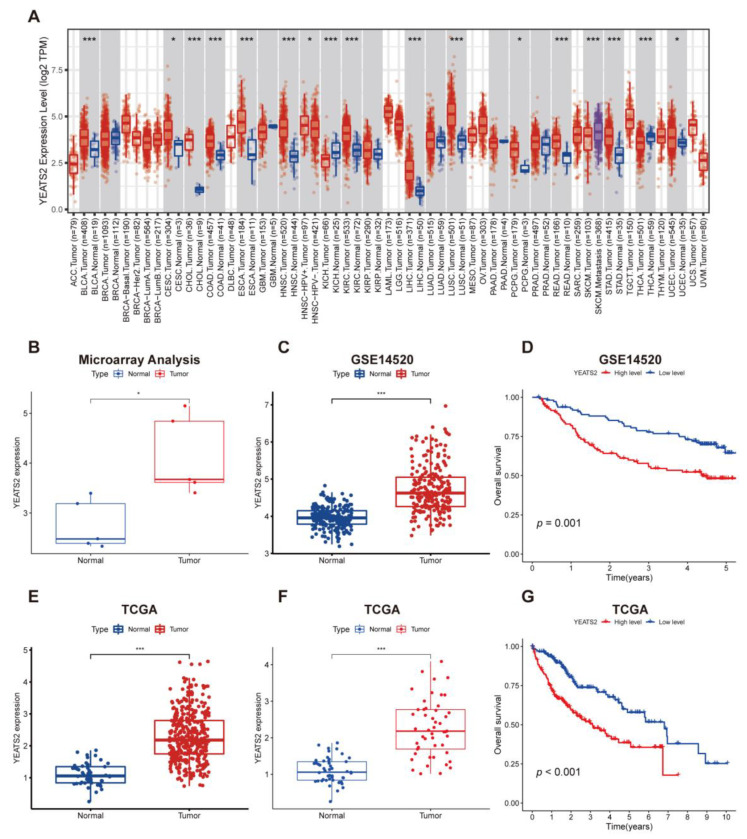
Figure 1.
Expression characteristics of YEATS2 in liver cancer samples and its relationship with clinical prognosis. (A) Expression of YEATS2 in multiple tumors in the TIMER database. (B) Expression of YEATS2 in microarray data analysis of paired samples. (C) In the GSE14520 dataset, the expression level of YEATS2 was higher in HCC tissues compared with normal liver tissues. (D) Kaplan–Meier analysis was performed on the overall survival (OS) of HCC patients according to the expression of YEATS2 in the GSE14520 dataset. (E) YEATS2 expression was identified in 373 tumors and 49 normal samples from TCGA. (F) Expression of YEATS2 in paired samples from TCGA. (G) Kaplan–Meier analysis was performed on the overall survival (OS) of HCC patients according to the expression of YEATS2 in the TCGA dataset. Data are presented as median and interquartile ranges. * p < 0.05, *** p < 0.001.

