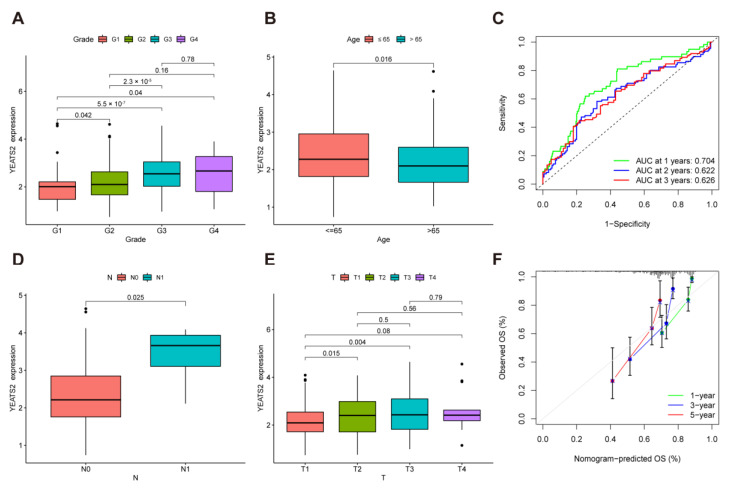
Figure 2.
Correlation analysis between YEATS2 expression and clinical features of liver cancer. (A) Relationship between YEATS2 expression and grades. (B) Relationship between YEATS2 expression and ages. (C) Time-dependent ROC analysis of YEATS2. (D) Relationship between YEATS2 expression and lymph node metastasis. (E) Relationship between YEATS2 expression and T stages. (F) Nomogram analysis of YEATS2. Data are presented as median and interquartile ranges.

