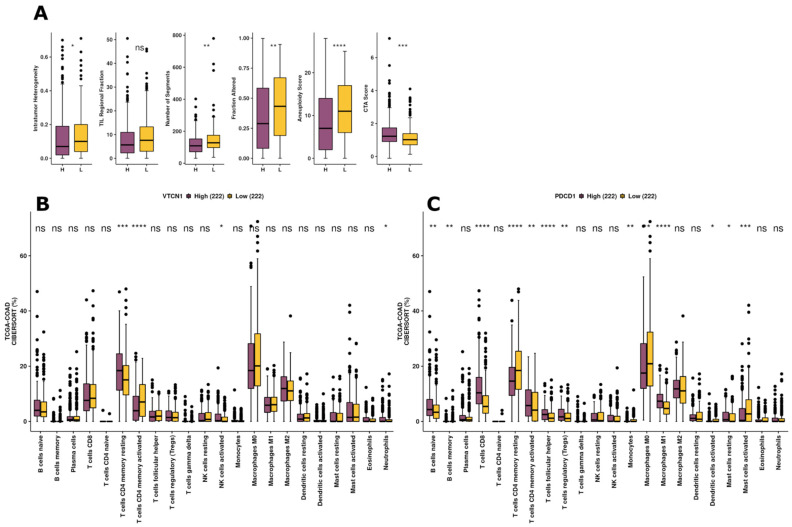
Figure 8.
Differences in immune-related scores between different VTCN1 and PDCD1 expression groups. (A) Immune cell infiltration scores were calculated by the CIBERSORT algorithm in high and low PDCD1 expression groups and VTCN1 high and low expression groups. (B,C) Analyses based on the TCGA-COAD dataset, * p < 0.05, ** p < 0.01, and *** p < 0.001, **** p < 0.0001.

