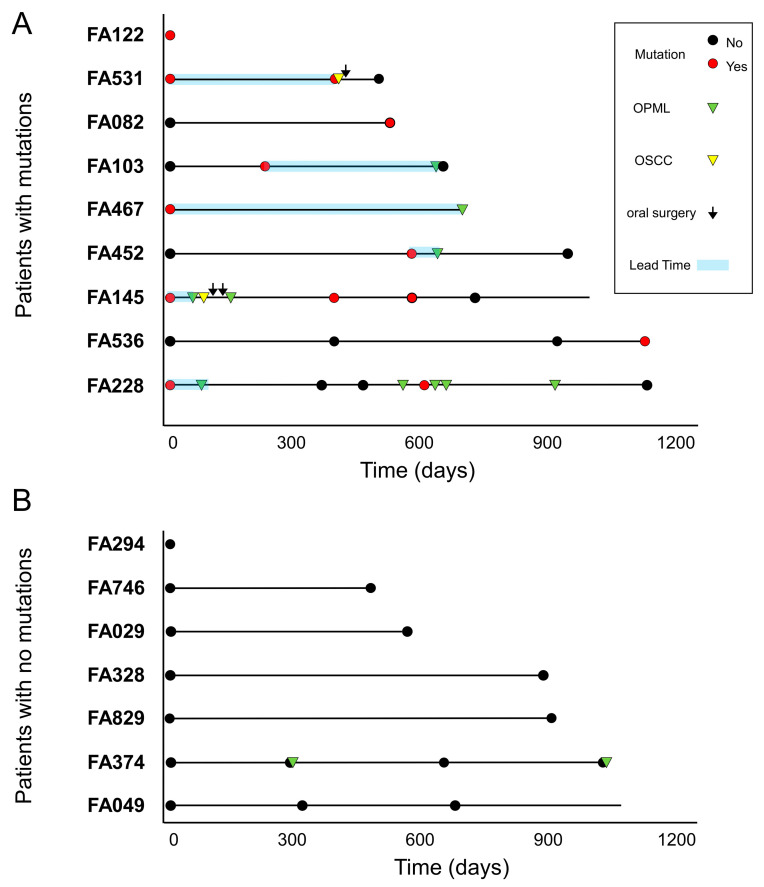
Figure 4.
Fanconi anemia patients with mutations develop OPML and/or OSCC. Schematic representation of the molecular and clinical events during patient’s follow-up. (A) A total of 9/16 patients had mutations in at least one liquid biopsy sample, and 6/9 patients had clinical follow-up data after mutations were found; all of them displayed OPML or OSCC afterwards. Time from mutation detection to tumor detection (lead time) is shown (blue boxes). Solid horizontal lines represent clinically informed follow-up times from the first LB analyzed in each patient. (B) A total of 7/16 patients displayed no mutations, 6 of whom were free of OPML or OSCC.

