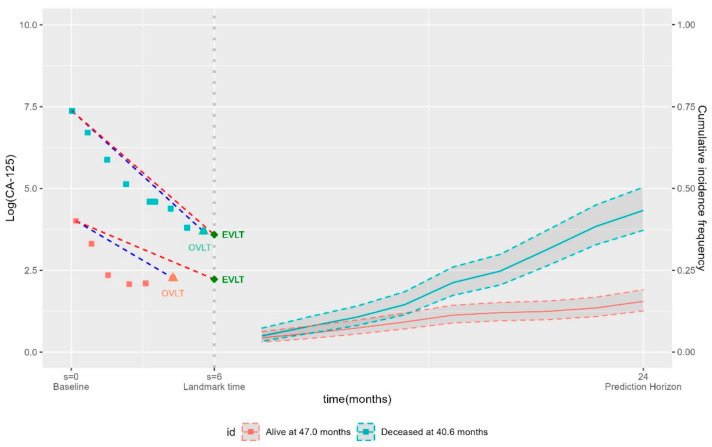
Figure 1.
Illustration of the landmark framework. CA-125 trajectories of observed values up to the landmark time of s = 6 months for two patients at risk of death at the landmark time (#1 alive after 56.9 months, and #2 deceased after 24.5 months). Their overall survival was assessed at t = 24 months. Summaries of the early CA-125 trajectory were obtained from values up to the landmark time (the blue dashed lines represent the observed slope, and the red dashed lines represent the estimated slope).

