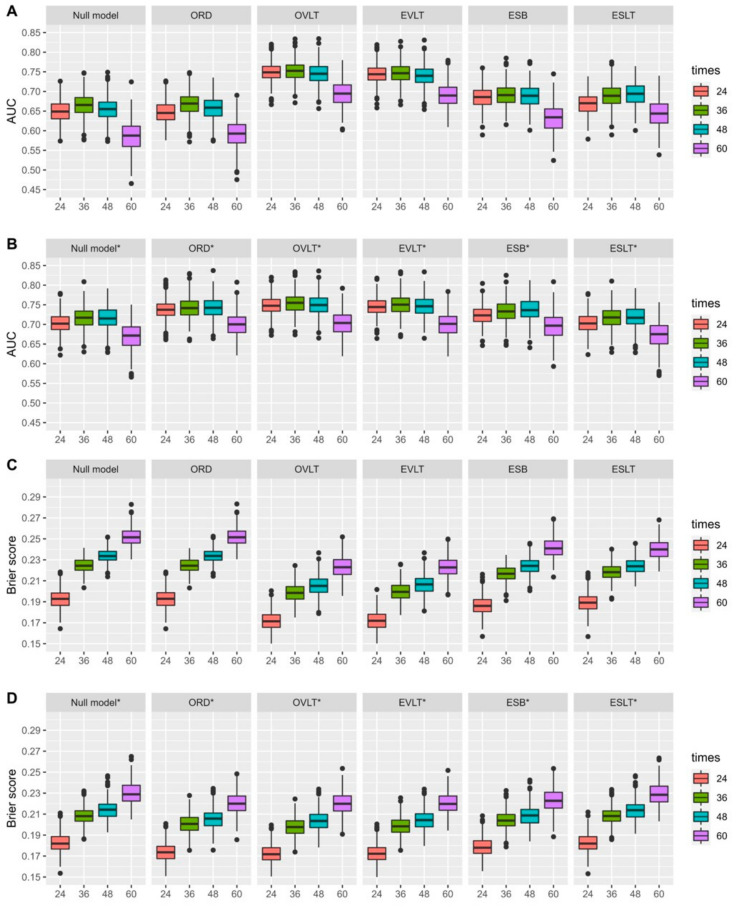
Figure 2.
The 10-fold cross-validated AUCs (A,B) and Brier scores (C,D) for the prediction of overall survival at 24, 36, 48, and 60 months from CA-125 history up to 3 months, considering different CA-125 summaries (ORD, OVLT, EVLT, ESB, ESLT) adjusted (B,D) or not (A,C) based on the CA-125 value at baseline. Null model: survival model stratified by study, ORD: observed relative decline, OVLT: observed value at landmark time, EVLT: estimated value at landmark time, ESB: estimated slope at baseline, ESLT: estimated slope at landmark time. * models adjusted for CA-125 at baseline. Note: The SCOTROC-1 trial was excluded for the landmark time at 6 months and prediction time at 36 months and for the landmark time at 3 months and prediction time at 48 months. The SCOTROC-4 and MITO-7 trials were excluded for both landmark times and for the prediction time of 60 months.

