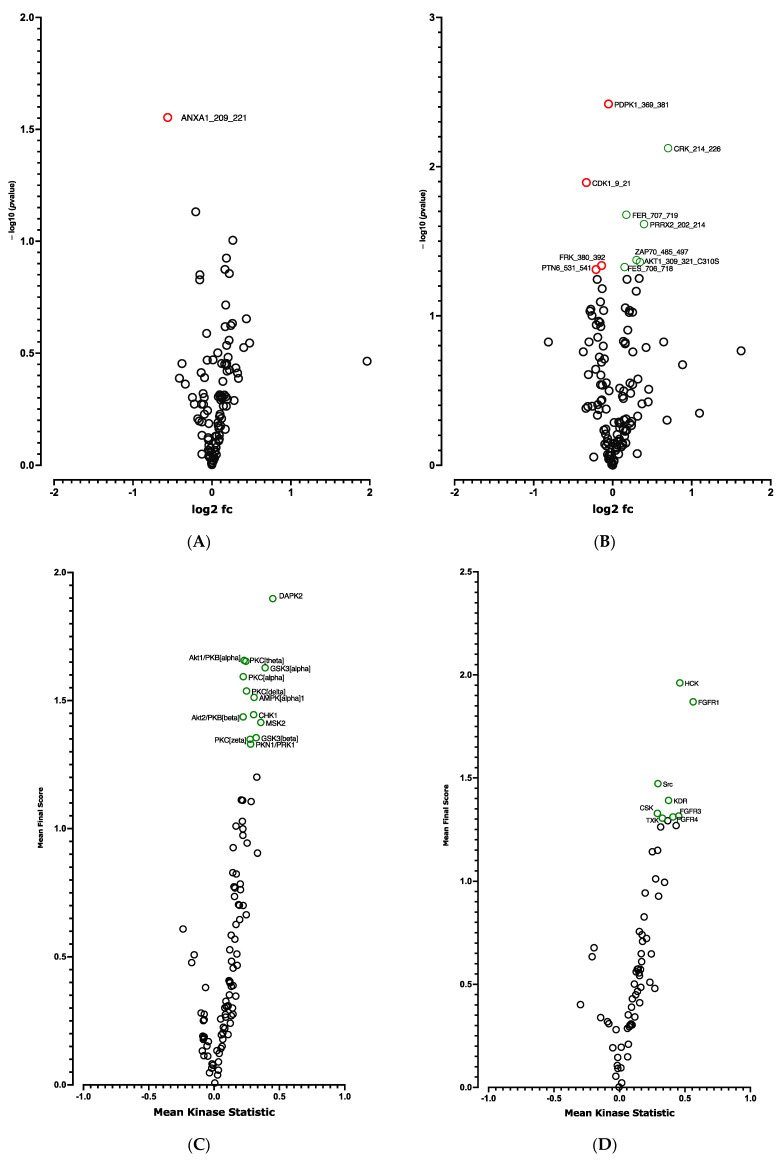
Figure 6.
Kinome analysis at spheroid stages of differentiation (D0) between CDKN2A-deficient and control hiPSC-BAPs. Volcano-plots of STK (A), PTK (B)-modulated peptides and STK (C), PTK (D)-modulated kinases. Green circle: hyperphosphorylated peptide (B) and kinase (C,D). Red circle: hypophosphorylated peptide (A,B). Dark circle: unmodulated peptide (A,B) and kinase (C,D).

