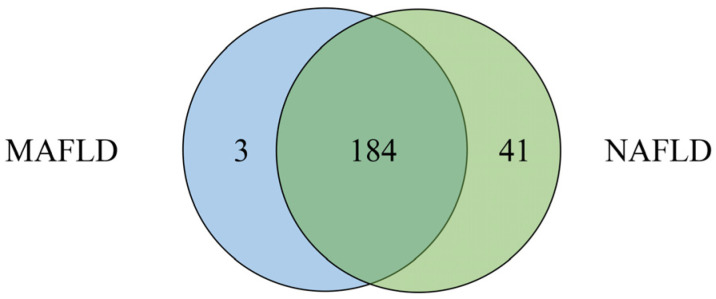
Figure 3.
Composition of MAFLD and NAFLD in NHANES 2017–2018. The blue circle indicates participants with metabolic-associated fatty liver disease (MAFLD), and the green circle indicates participants with nonalcoholic fatty liver disease (NAFLD); the middle overlapping part indicates participants with both MAFLD and NAFLD.

