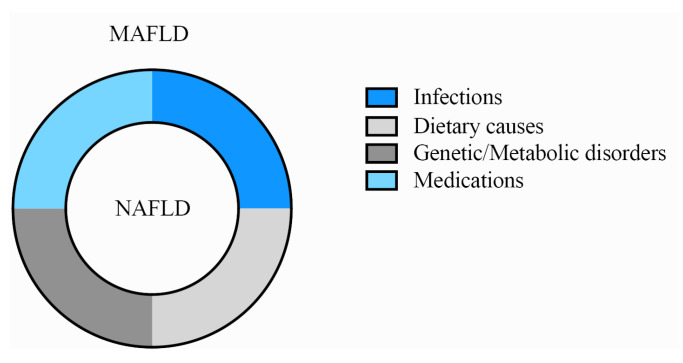
Figure 4.
The relationship between MAFLD and NAFLD (wheel model). The inner circle represents nonalcoholic fatty liver disease (NAFLD), and the outer circle represents metabolic-associated fatty liver disease (MAFLD). The four colors indicate infections, dietary causes, medications and genetic/metabolic disorders.

