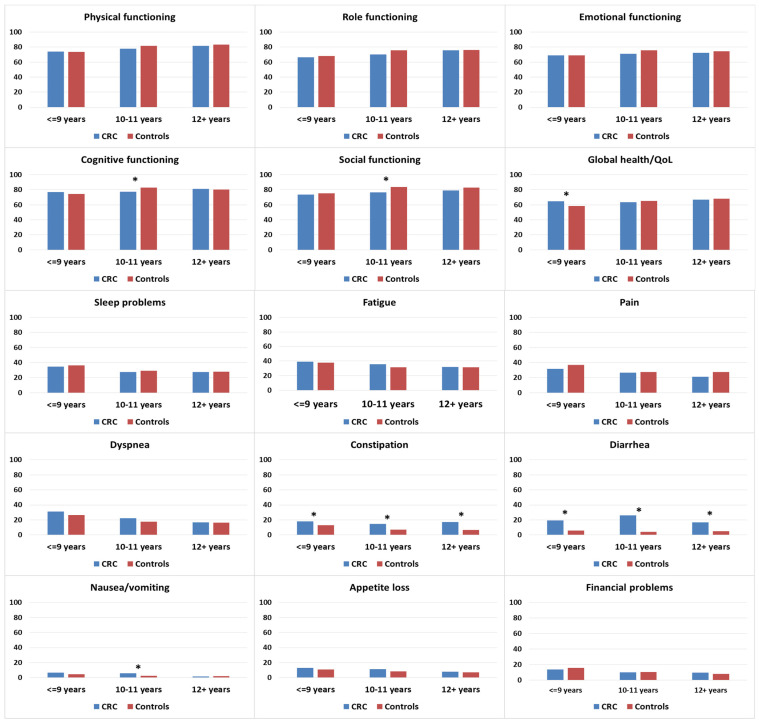
Figure 4.
Mean EORTC QLQ-C30 scores of colorectal cancer (CRC survivors) and controls, stratified by education. Models are adjusted for age at survey and sex. Asterisks (*) indicate significantly significant differences (p < 0.05) between the subgroups. All results are based on 25 imputations of missing values.

