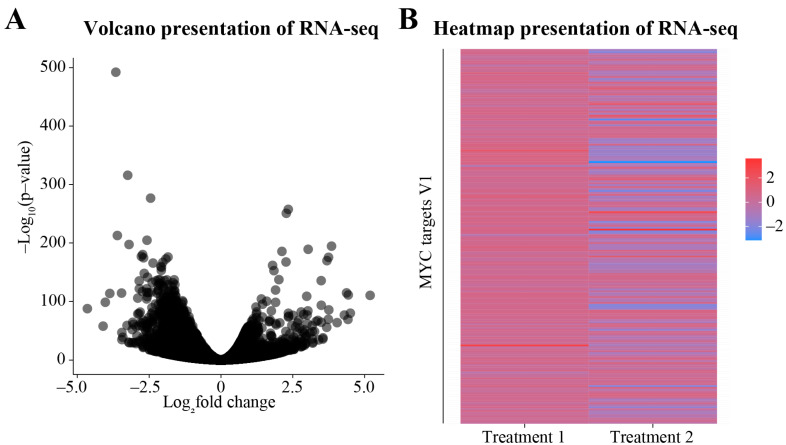
Figure 4.
Presenting RNA-seq data using R. Refer to the supplementary document to find the relevant R scripts. Publicly available dataset (GSE116778) [33] was used to demonstrate how RNA-seq data can be visualized. (A) A volcano plot depicting the log2 fold change and the significance of the differentially expressed genes (DEGs) in treatment 1 (AT7519) [33]. Volcano plots are one of the most widely used modes of representation of DEGs as they depict both the fold change and the level of significance. (B) Heatmaps are a useful presentation method to compare multiple conditions. The heatmap here shows the Log2 fold change in the MYC target genes from two treatment conditions (AT7519 and AT7519 + OSMI-2).

