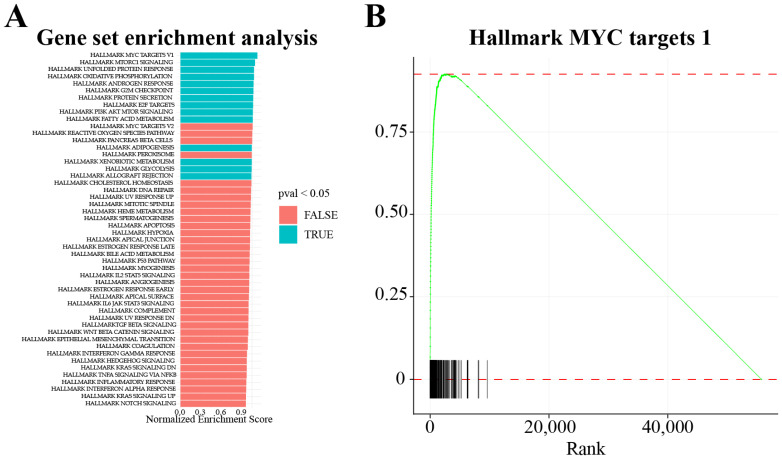
Figure 5.
Gene set enrichment analysis (GSEA). Refer to the supplementary document to find the relevant R scripts. (A) All the DEGs from knockdown of O-GlcNAc transferase after 48 h in LNCaP cells were subjected to GSEA to identify the processes affected. The normalized enrichment score assigned by the GSEA algorithm is plotted and the color of the bar depicts the significance (blue: significant; red: non-significant) (data from GSE169090) [39]. (B) The enrichment score of the DEGs belonging to the significant pathway can be plotted using the GSEA enrichment plot. Here are plotted the MYC targets V1 Hallmark gene set for knockdown of O-GlcNAc transferase after 48 h in LNCaP cells. The X-axis shows the rank of the DEGs (calculated based on the log2 fold change and the p-value), and the Y-axis shows the enrichment scores.

