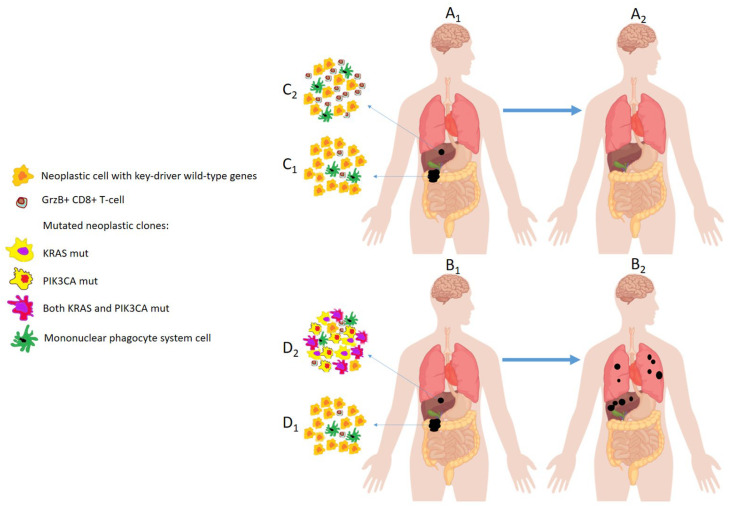
Figure 2.
The figure shows two patients (A1,B1) who have the same onset of de novo OMD. Both patients receive radical excision of all lesions (primary tumor and single liver metastases). Patient A1 is disease-free at the 3-year follow-up (A2) (“true” OMD). Patient B1 develops poly-metastatic disease (“false” OMD) within 1 year of follow-up (B2). The markers that clearly differentiate these two clinical entities that apparently have the same onset are unknown. Previous evidence suggests that the dynamic study of the primary tumor and metastases (C1 vs. C2 and D1 vs. D2) could provide important prognostic indications. High infiltrates of cytotoxic granzyme-b positive (GrzB+) CD8+ T cells and the regression of key-driver mutation clones could be the basis for true OMD. The cellular composition of the tumor mass is shown in the figure (C1,C2,D1,D2) to focus on these two last concepts. Some types of cells that make up the tumor microenvironment, such as neutrophils, mast cells, fibroblasts, regulatory cells, etc., have been omitted.

