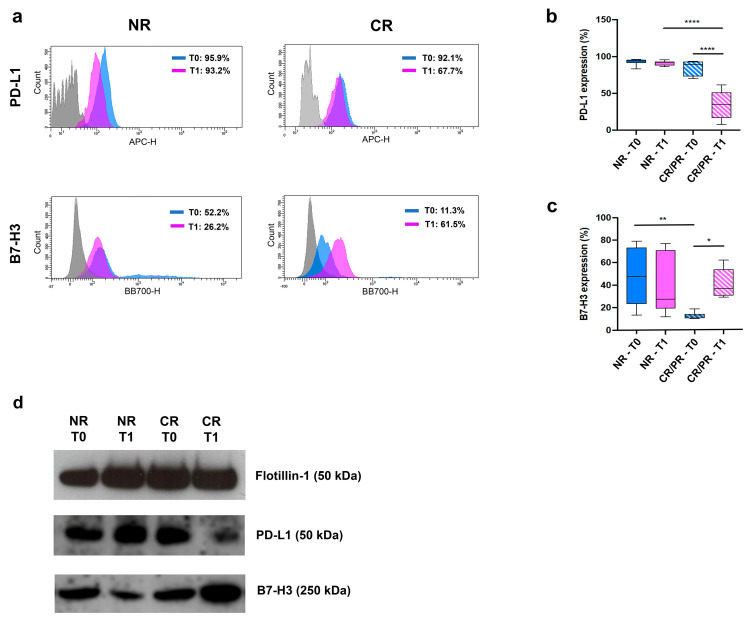
Figure 4.
(a) Representative flow cytometry analysis of EVs derived from plasma of NR (#146) and CR (#174) patients, at both T0 and T1. Areas under blue and pink lines indicate EVs reacting with PD-L1 (upper panels) or B7-H3 (bottom panels) at T0 and T1, respectively. Areas under the grey lines indicate the interactions of vesicles with corresponding non-reactive immunoglobulin of the same isotype. (b,c) Histograms representing the percentage of PD-L1- (b) or B7-H3-positive EVs (c) derived from NR and CR/PR patients, at both T0 and T1. *: p < 0.05, **: p < 0.01, ****: p < 0.0001 (one-way ANOVA). (d) Western blot analysis of Flotillin-1, PD-L1 and B7-H3 on EVs derived from plasma of NR (#146) and CR (#174) patients, at both T0 and T1.

