Figure 5.
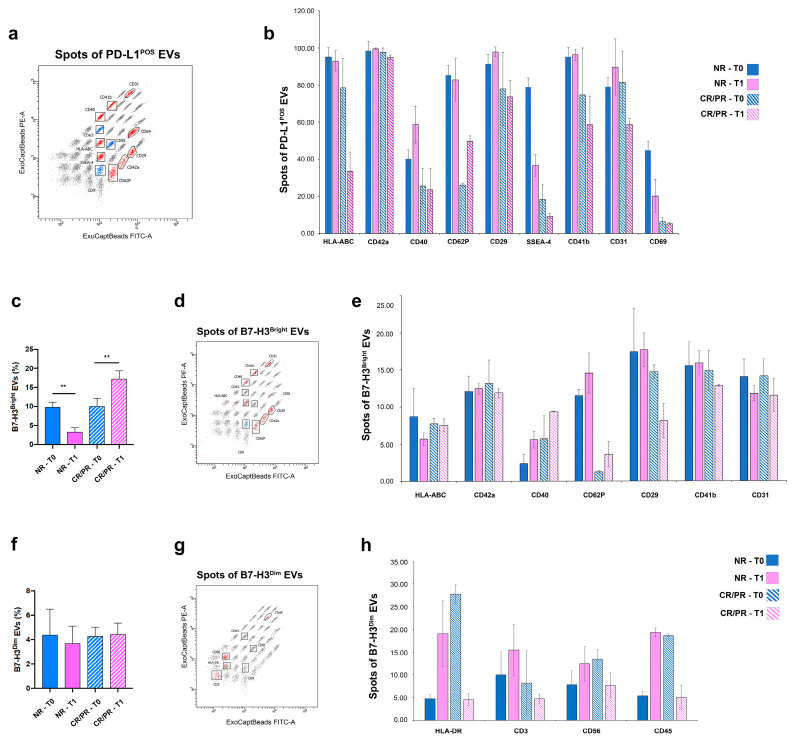
EV surface proteins profiled by multiplex bead-based flow cytometry assay. Captured EVs were counterstained with APC-labelled detection antibodies (mixture of anti-CD9, -CD63 and -CD81 antibodies). (a,d,g) Dot charts of beads corresponding to each of the 37 proteins. Red dots indicate: (a) PD-L1-expressing EVs identified above detection threshold in any of the patients, after normalizing their expression against CD9/CD63/CD81 MFI; (d) B7-H3Bright EVs identified above detection threshold after normalizing their expression against CD9 MFI; (g) B7-H3Dim EVs identified above detection threshold after normalizing their expression against CD81 MFI. Blue dots correspond to tetraspanin marker whereas black dots correspond to negative markers. (b,e,h) Histograms represent: (b) 9 out of 37 proteins that were found to be positive in PD-L1-expressing EVs isolated from any of the patients; (e) 7 out of 37 proteins that were found to be positive in B7-H3Bright EVs isolated from any of the patients; (h) 4 out of 37 proteins that were found to be positive in B7-H3Dim EVs isolated from any patients. (c,f) Histograms represent: percentage of B7-H3Bright (c) B7-H3Dim (f) and EVs isolated from NR and CR/PR patients at both T0 and T1. Error bars in graphs represent mean ± SD. ** p < 0.01 (Ordinary one-way ANOVA).

