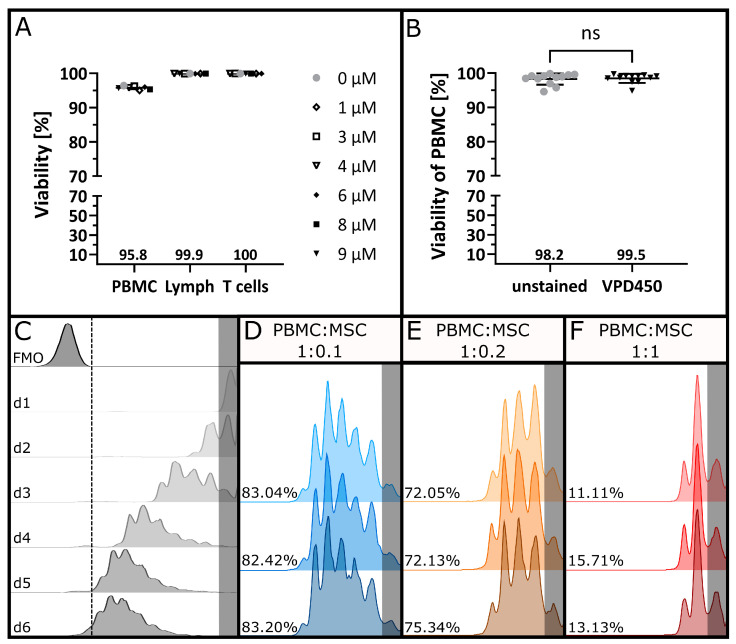
Figure 1.
Proliferation tracking of PBMCs. (A) Viability of PBMCs was determined using 7AAD after staining with increasing concentrations of VPD450 to assess the cytotoxicity of the proliferation dye. Mean values are indicated below the plots. (B) Viability of PBMCs after staining with VPD450 was compared to the viability of the respective unstained controls. Mean values for n = 12 stainings are indicated below the plots. Statistical analysis was performed using a two-tailed Wilcoxon test with α = 0.05. (C) VPD450-based proliferation tracking of PBMC donor pairs after co-stimulation with anti-CD3 and anti-CD28 antibodies after one, two, three, four, five and six days in culture. Histograms display VPD450 fluorescence intensity after gating on CD5+ and CD4+ or CD8+ T cells. (D) Triplicate measurement of co-stimulated PBMC donor pairs after four days of co-culture with MSCs in a 1:0.1 ratio, (E) in a 1:0.2 ratio and (F) in a 1:1 ratio. Undivided generations are highlighted in grey, and respective Dil [%] values are indicated for each replicate.

