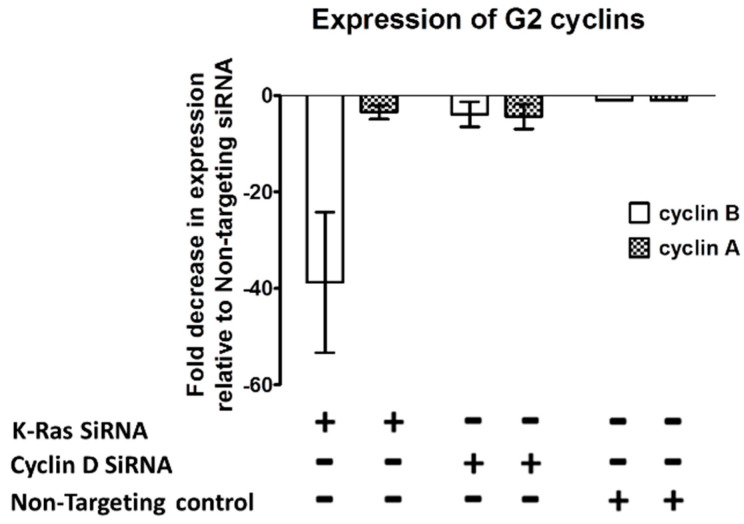
Figure 5.
Effect of K-Ras depletion on G2 cyclin transcription. Graph showing an example of the decrease observed in G2 cyclin transcript when K-Ras or cyclin D is depleted. Cyclin B transcript levels after depletion with K-Ras are significantly lower than in non-targeting controls and after depletion with cyclin D (p < 0.001, Mann–Whitney U test, standard deviation used as error bar). Cyclin A levels are also significantly lower after depletion of K-Ras than with no depletion; however, there was an equivalent decrease after cyclin D depletion.

