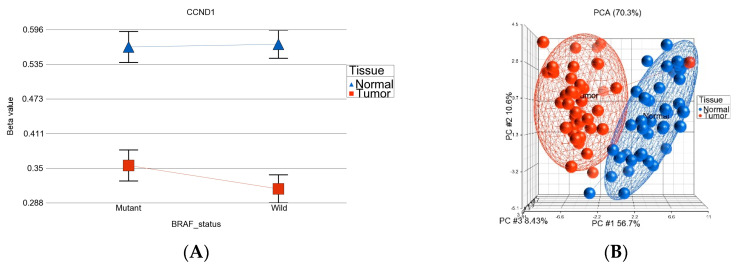
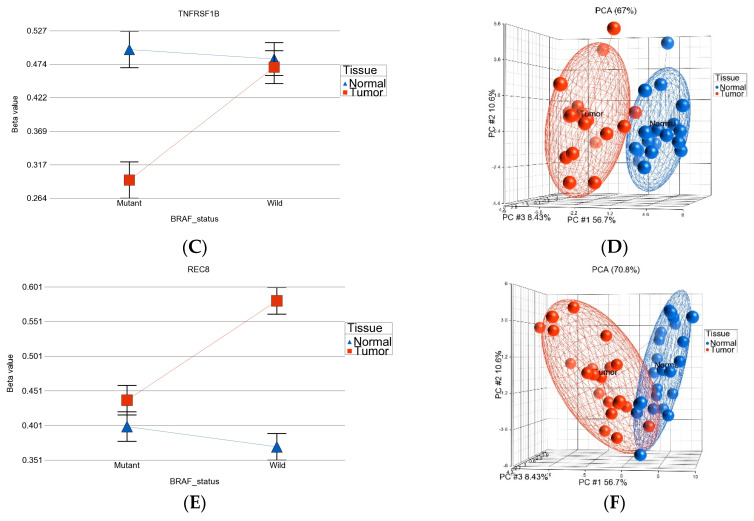
Figure 4.
Three sets of DML in thyroid cancer. Examples of one locus from each set are shown on the left side (ACE), and the PCA plots from all the DML of each set are shown on the right side (B,D,F). The top panel (A,B) represents the 51 DML common in BRAF mutant and BRAF wild-type tumors, where (A) shows an example of this group—CCND1 was significantly hypomethylated in tumor tissue compared to normal tissue, and the magnitude of differential methylation in BRAF mutant and wild-type was not different (interaction p > 0.05); (B) shows separation of the tumor tissue and normal tissue based on these common 51 DML. The middle panel (C,D) represents the BRAF mutation-specific 35 DML; the lower panel (E,F) shows the BRAF wild-type-specific 62 DML.


