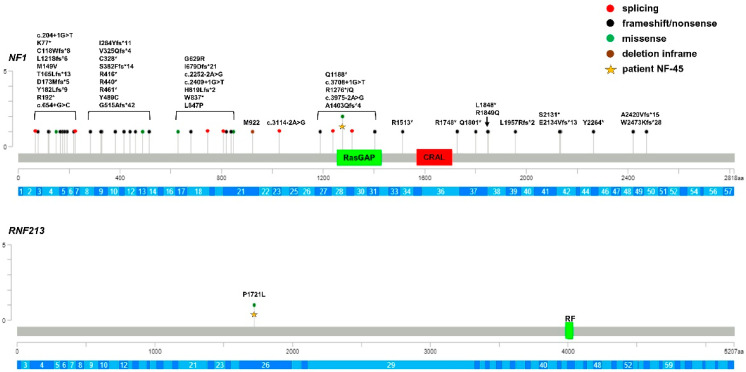
Figure 2.
Lolliplot graph showing distribution and frequency of NF1 and RNF213 variants identified in NF1 patients. Yellow star identifies variants carried by the same patient. RasGAP: Ras GTPase activating protein domain; CRAL: CRAL-TRIO lipid-binding domain (cellular retinaldehyde-binding protein and TRIO guanine exchange factor); RF: RING finger domain; aa: number of protein amino acids; c.: number of nucleotide in the coding region of the gene. *: stop codon. The gene exons are schematized in dark and light blue.

