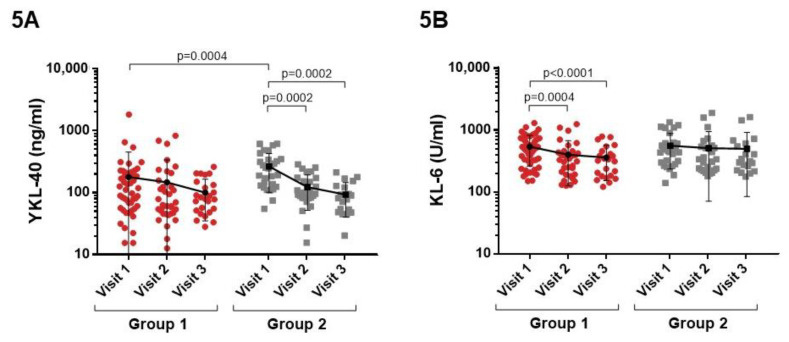
Figure 5.
Comparison of YKL-40 and KL-6 levels between patients of Group 1 and 2 at visit 1 and in the follow-up visits (A,B). (A) At visit 1, higher YKL-40 levels were observed in patients of Group 2 (p = 0.0004). (B) High serum KL-6 levels were observed in both groups at visit 1, but these levels fell in patients of Group 1 in the follow-up visits.

