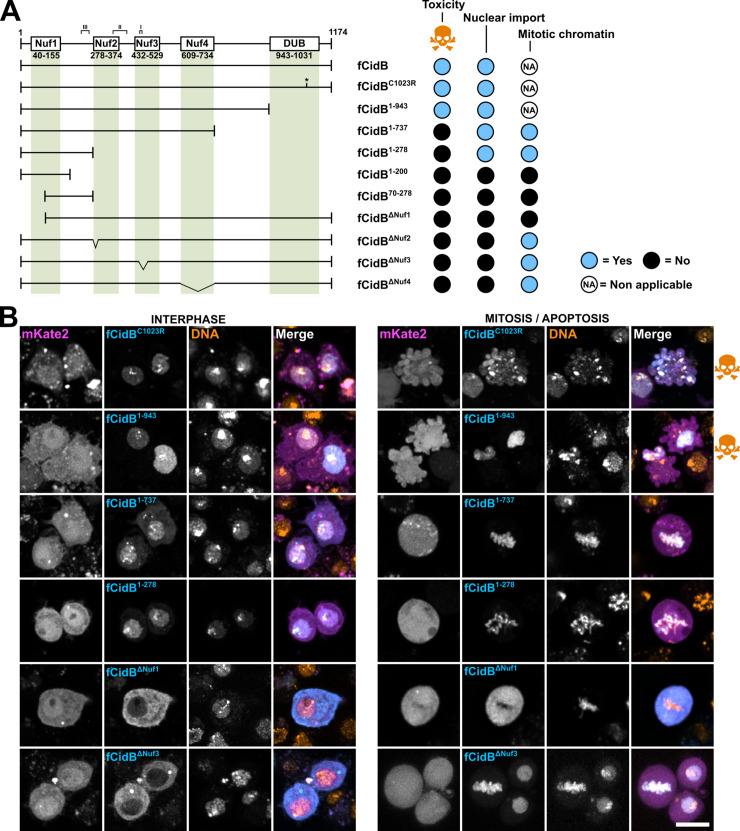
Fig 3. Structure-function analysis of CidB.
(A) Schematic representation of CidB with its previously identified domains, together with the various deletion mutants tested and associated phenotypes. When CidB or its mutants are toxic and prevent mitosis, the localization to the mitotic chromatin is non applicable. (B) Confocal images of S2R+ cells transfected with fCidB mutants showing the subcellular localization in interphase and its outcome illustrated either by mitotic figures or apoptotic events -blebbing cells with fragmented DNA, skull and crossbones symbol-. CidB mutants are in cyan, free mkate2 in magenta and DNA -Hoechst- in yellow. Scale bar = 10 μm.

