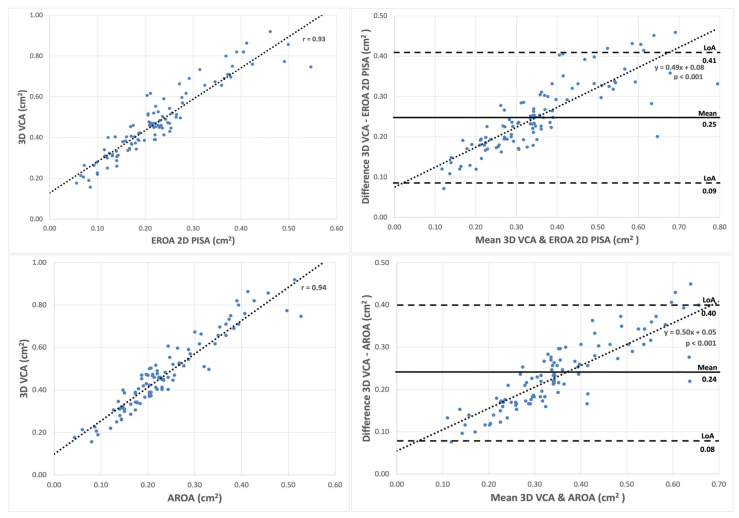
Figure 6.
Correlations (left) and Bland–Altman plot (right) for 3D VCA. Correlation (upper left) and Bland–Altman plot (upper right) of 3D VCA compared to EROA 2D PISA. Correlation (lower left) and Bland–Altman plot (lower right) in comparison with AROA. Correlation plots with pairs of value using two methods. Bland–Altman plots with differences of two methods plotted against the mean values of the same methods (right). Dotted lines = fitting line of linear regression, solid lines = mean differences of two methods, dashed lines = limits of agreement (LoA). Abbreviations: 2D = two-dimensional; 3D = three-dimensional; EROA = effective regurgitation area; PISA = proximal isovelocity surface area; VCA = vena contracta area, AROA = anatomic regurgitation orifice area.

