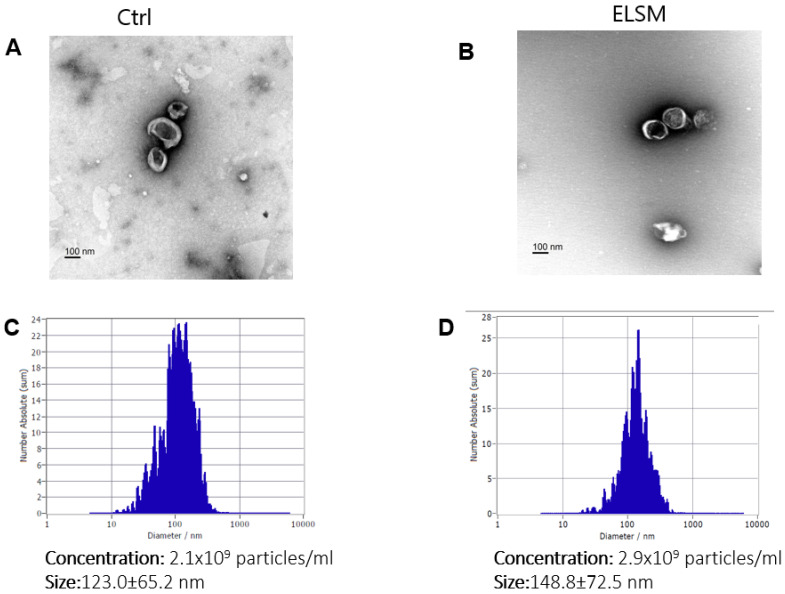
Figure 1.
Characterization of EVs from C-MSCCtrl and C-MSCELSM. (A,B) Transmission electron micrograph images of EVs from C-MSC. Scale bar = 100 nm. (C,D) nanoparticle tracking analysis using ZetaView® Particle Tracking Analyzer to measure the size and number of C-MSC-derived EVs with or without ELSM.

