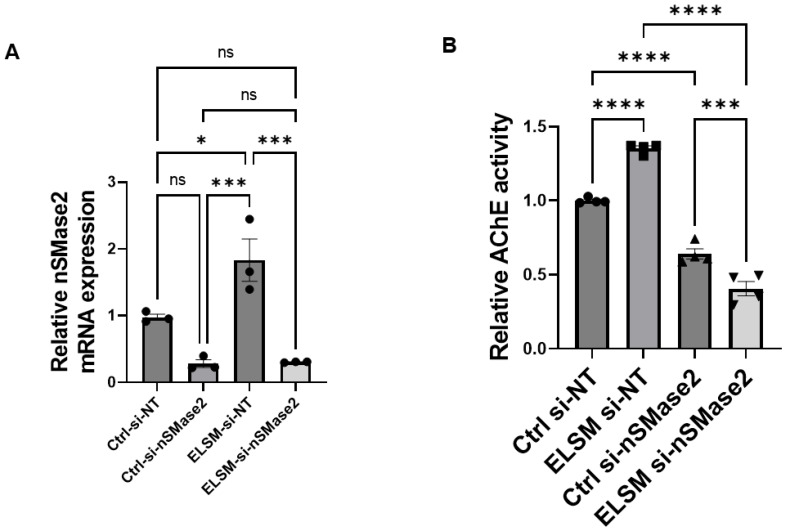
Figure 4.
Knockdown of nSMase2 inhibits ELSM-induced EV release from C-MSC. (A) qRT-PCR quantification of nSMase2 mRNA levels (normalized to β-actin levels) in C-MSC transfected with nSMase2 siRNA (si-nSMase2) versus si-NT with/without ELSM treatment (ns not significant; * p < 0.05, *** p < 0.001, n = 3). (B) Quantification of relative AChE activity (normalized to protein concentration and then normalizing to the Ctrl si-NC group) in EVs from si-NT and si-nSMase2-transfected C-MSC with/without ELSM treatment (*** p < 0.001, **** p < 0.0001, n = 4).

