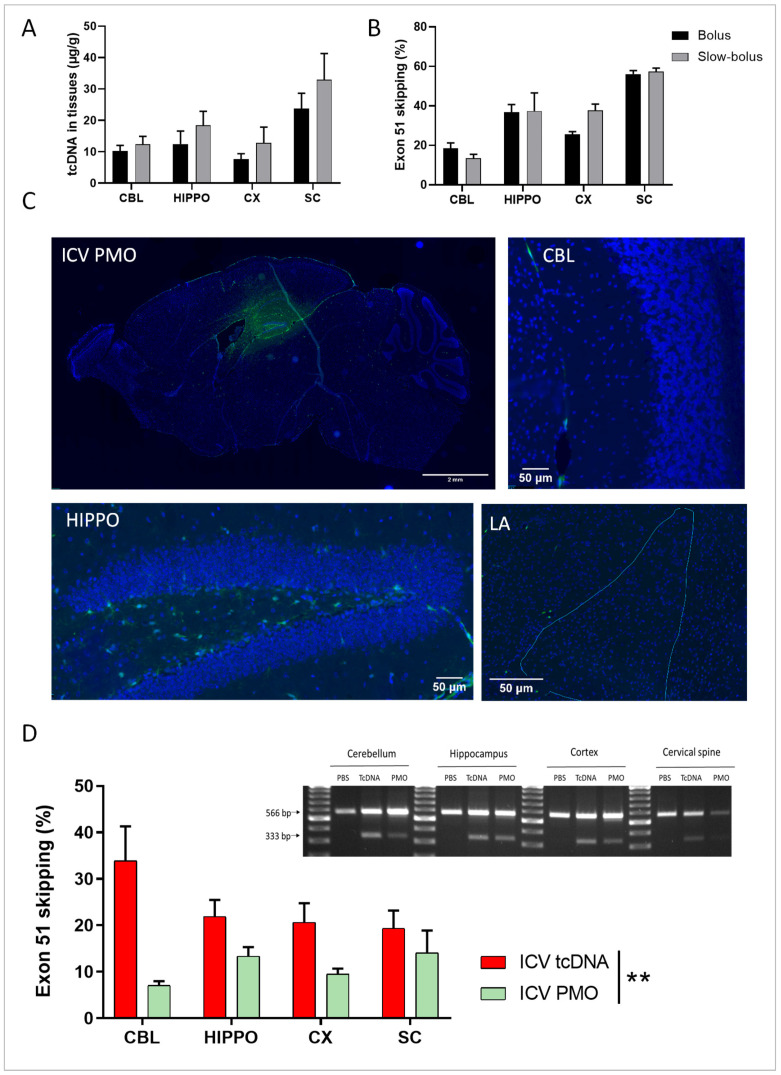
Figure 1.
Quantification of tcDNA and PMO in specific brain regions and exon skipping after single ICV delivery. (A) Quantification by fluorescent hybridization assay of tcDNA-Ex51 content in various CNS tissues 4 weeks after the ICV administration using a bolus or a slow-bolus rate. Results are expressed as means ± SEMs; n = 4 hDMD-tcDNA-Ex51. (B) Quantification of exon 51-skipping levels via RT-qPCR in different brain tissues 4 weeks after the ICV administration using a bolus or a slow-bolus rate. Results are expressed as means ± SEMs; n = 4 hDMD-tcDNA-Ex51. (C) Carboxyfluorescein-conjugated PMO detected 48 h post-ICV slow-bolus rate delivery. Representative images show a sagittal section (scale bar 2 mm), cerebellum lobules IV-V (CBL), hippocampus dentate gyrus (HIPPO), and the lateral amygdala (LA), n = 3, (scale bars 50 µm). (D) Left panel: quantification of exon 51-skipping levels via RT-qPCR in different brain tissues after a slow-bolus rate ICV administration. Right panel: detection of exon 51-skipped dystrophin mRNA via RT-PCR in different brain tissues 7 weeks after the ICV administration of saline (PBS), tcDNA-ex51 (n = 5), or PMO-ex51 (n = 3) in mdx52 mice. CBL: cerebellum, CX: cortex, HIPPO: hippocampus, and SC: spinal cord (cervical region). ** p < 0.01 between tcDNA and PMO treatment analyzed via RM two-way ANOVA.

