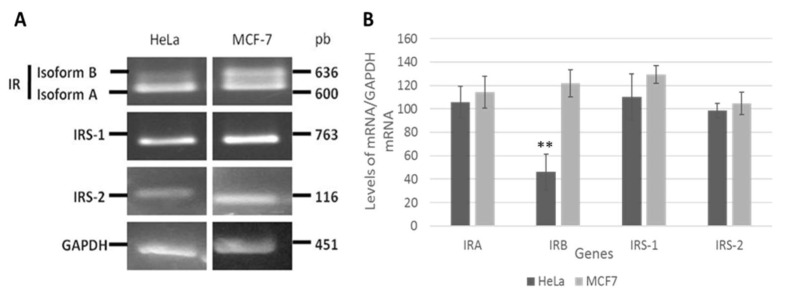
Figure 1.
Insulin receptor (IR) isoforms are differentially expressed in HeLa cells. The mRNA levels of IR isoforms and IRS1/2 genes were analyzed in HeLa and MCF7 cell lines. Total RNA was purified, and mRNA levels were analyzed by RT-PCR with specific primers. (A) The 600 and 636 bp fragments correspond to isoforms A and B of the insulin receptor, respectively. Amplified fragments of 763 and 116 bp correspond to IRS-1 and IRS-2, respectively. The amplified fragment of 451bp corresponds to GAPDH (control). (B) Densitometric analysis of IRA, IRB, IRS1, IRS2, and GAPDH mRNA levels. The graph represents the mean ± SEM of three independent experiments (n = 3). ** p < 0.01 compared to IRA.

