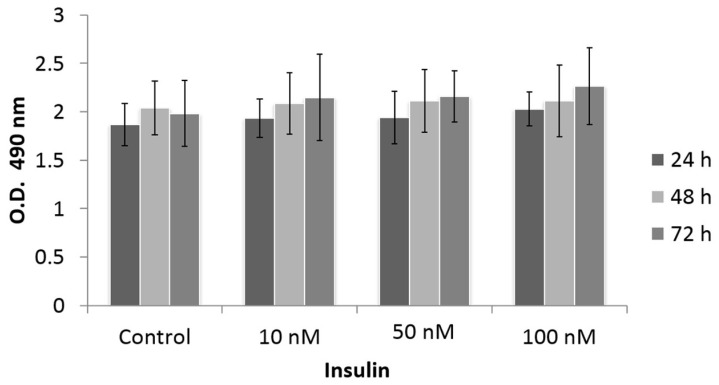
Figure 2.
Effect of insulin on the proliferation of HeLa cells with MTS assay. HeLa cells were treated with different insulin doses at different times of stimulation. The histograms represent the mean value ± standard error of the mean (SEM) of optic density values. The control group is cells without treatment. The graphs represent the mean ± SEM of three independent experiments (n = 6).

