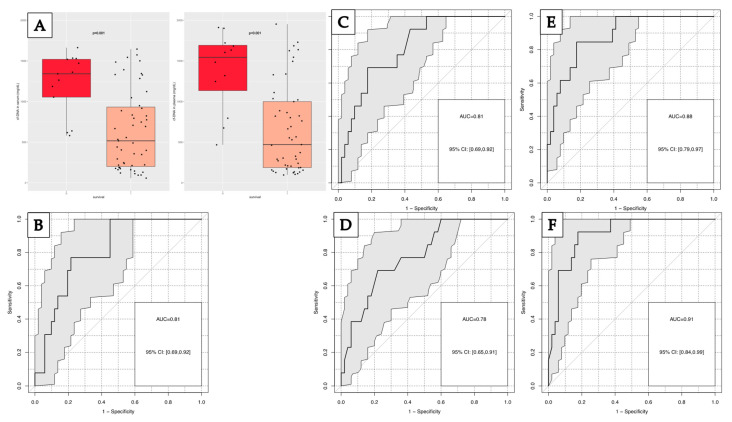
Figure 8.
(A) Distribution of cfDNA concentration in serum and plasma in non-surviving (0) and surviving (1) patients; Receiver operating characteristic curve for the discrimination of one-week survival for: (B) cfDNA in serum; (C) cfDNA in plasma; (D) hemoglobin; (E) cfDNA in plasma, hemoglobin and leukocytes; (F) random forest model of all parameters for one-week mortality.

