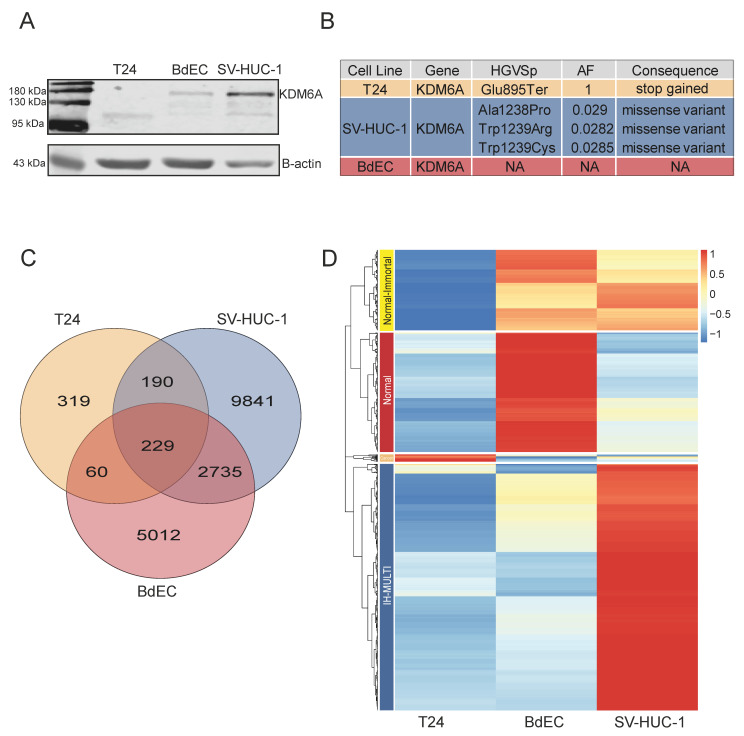
Figure 1.
Occupancy and mutation profile of KDM6A in different bladder cell lines. (A) Western blot image displaying expression of KDM6A at protein level. (B) Image represents the details concerning depth, allele frequency, and alternative alleles related to mutation status of KDM6A. (C) Venn diagram showing the overlap among KDM6A peaks called in T24, SV-HUC-1, and BdEC cell lines. (D) Heatmap shows the hierarchical clustering of KDM6A peaks, resulting in 4 clusters: normal-immortal (n = 235), normal (n = 349), cancer (n = 21), and IH-MULTI (n = 721).

