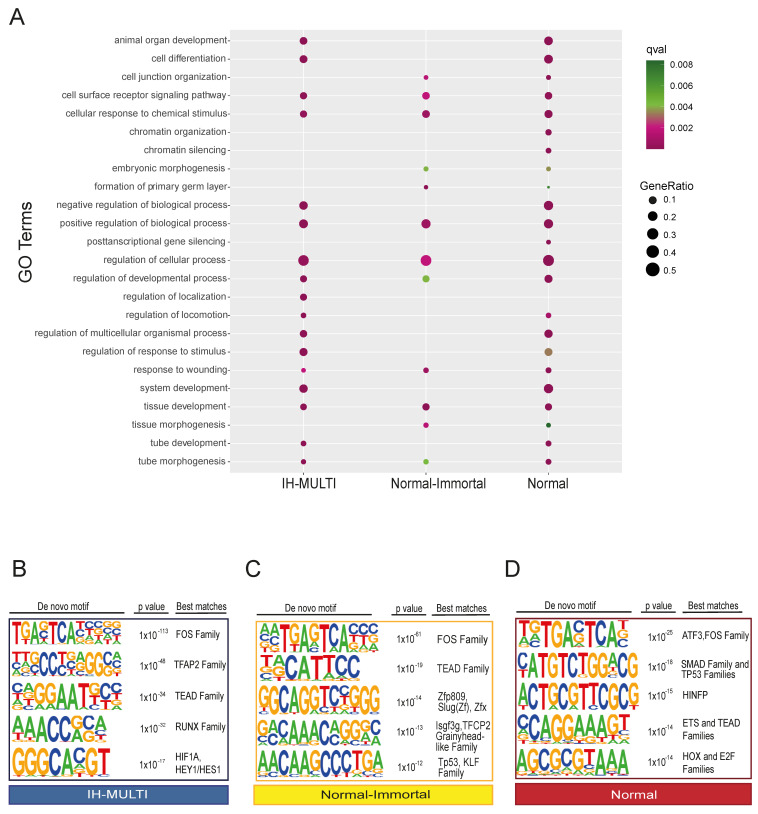
Figure 2.
Functional analysis of differential KDM6A peak sets identified across the cell lines. (A) Dot plot image displaying the GO term analysis performed for the genes associated with different clusters. (B–D) Transcription factor motif analysis performed for IH-MULTI (B), normal-immortal (C), and normal (D) clusters. Up to 3 different transcription factors/transcription factor families are shown with the best motif matching scores.

