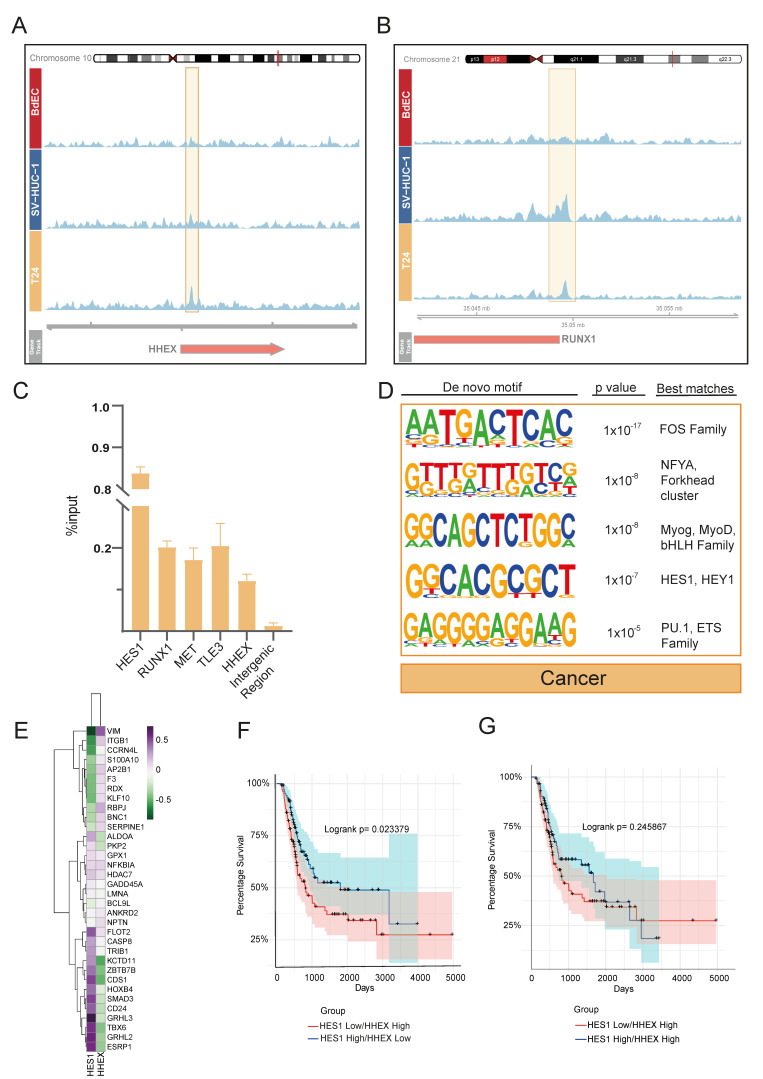
Figure 4.
Genomic occupancy profile of truncated KDM6A in T24 bladder cancer cell line. (A,B) Snapshot images showing KDM6A signal in BdEC, SV-HUC-1, and T24 cell lines at HHEX (A) and RUNX1 (B) loci. (C) ChIP-qPCR analysis of KDM6A enrichment in T24 cell line at selected loci. (D) Transcription factor motif enrichment analysis of T24 KDM6A peaks linked with genes. (E) Heatmap demonstrates the correlation between the expression of HES1, HHEX, and the genes involved in the regulation of developmental processes in primary bladder cancer. (F) Kaplan–Meier graph shows the overall survival of primary bladder cancer patients, grouped according to the expression status of HES1 and HHEX. (G) Kaplan–Meier graph shows the overall survival of primary bladder cancer patients, grouped according to the expression status of HES1 with high ‘HHEX’ criteria.

