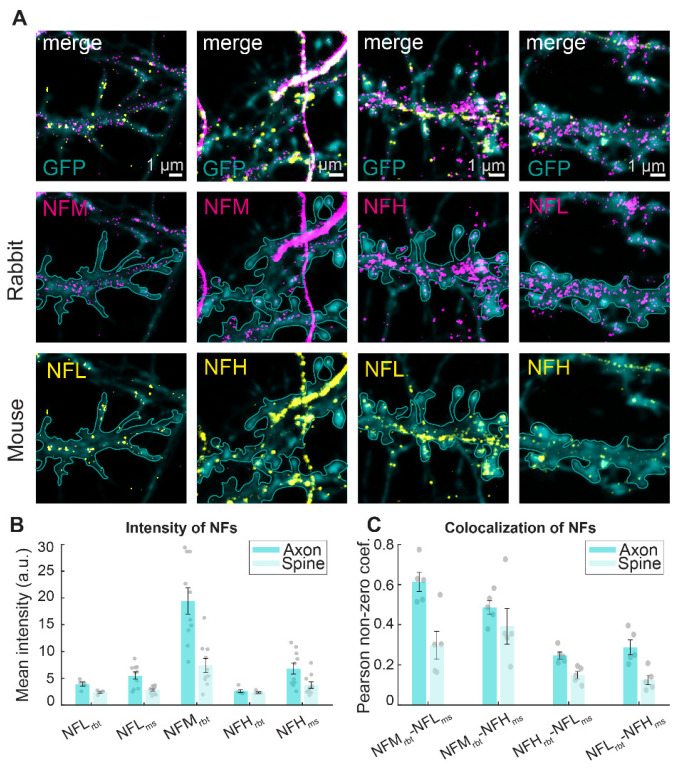
Figure 1.

Distribution of NF signal in different neuronal compartments. (A) Representative STED images of NF isoforms (magenta for rabbit (rbt) and yellow for mouse (ms)) and confocal GFP volume labeling (cyan) in primary hippocampal neurons. Corresponding large fields of view images can be found in Figure S1. Cyan outline represents spine shapes on dendrites as determined by volume labeling. Scale bars are 1 µm. (B) Mean fluorescence intensity of the NF isoforms in axons and dendritic spines. (C) Colocalization analysis of NFs in axons and dendrites. Shown is the mean values of Pearson’s correlation coefficient of all pixels with non-zero intensities. Error bars show the standard error of the mean (SEM), points represent average values of individual images. Intensities and colocalization data calculated from 5 images per antibody pair from one neuronal culture (21–26 DIV). Number of spines: NFMrbt-NFLms = 171; NFMrbt-NFHms = 63; NFHrbt-NFLms = 148; NFLrbt-NFHms = 100.
