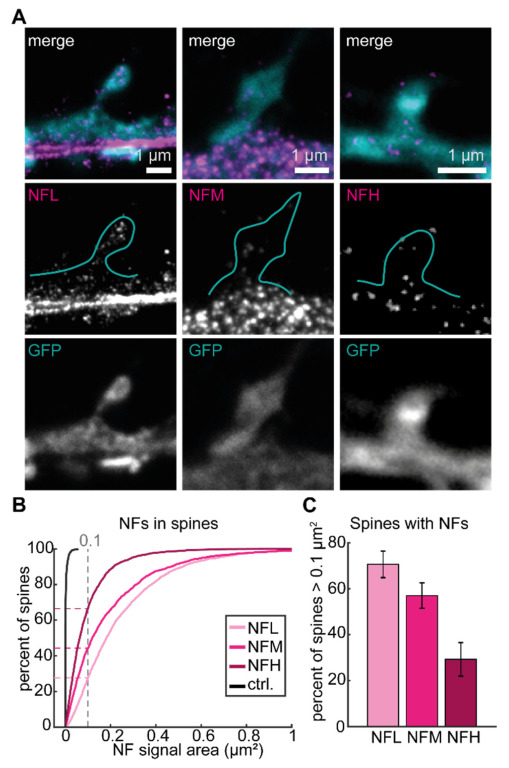
Figure 2.

NF isoforms are found at the postsynapse. (A) Representative STED images of dendritic spines with NFs (magenta) and volume labeling (confocal, cyan) with NFL (left), NFM (middle), or NFH (right). Spine shape as seen in volume labeling is represented in cyan outline. Scale bars are 1 µm. (B) Cumulative distribution of spines containing NFs compared to control without primary antibody labeling. Dashed lines indicate individual values at a 0.1 µm2 threshold. (C) Percentage of spines containing more than 0.1 µm2 of NF signal. Data was calculated from a total of 7115 spines (NFL = 2242, NFM = 1775, NFH = 2342, ctrl = 756) manually segmented from 34–40 images per isoform from 8 independent neuronal cultures (14–36 DIV), 15 images from 3 independent neuronal cultures for ctrl). Error bars show the standard error of the mean (SEM).
