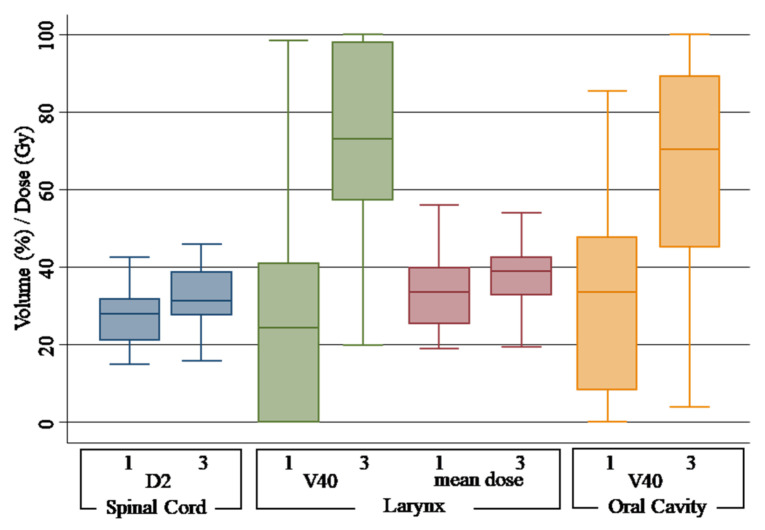
Figure 3.
Box plot of dose-volume histogram indicators for spinal cord, larynx and oral cavity. Different scenarios are indicated as follows: 1, original plan and simulation CT (OPLAN); 3, original plan and second simulation CT (DPLAN). Differences between scenarios were found to be significant (p < 0.05) for all parameters.

