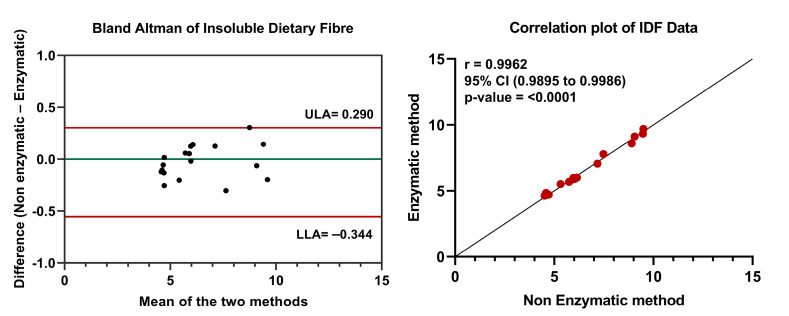
Figure 1.
Comparison of IDF data from enzymatic and non-enzymatic methods. Bland–Altman plot was created by plotting the average and difference between the enzymatic and non-enzymatic methods. LA—Upper limit of agreement; LLA—Lower limit of agreement. Pearson’s correlation coefficient was calculated for IDF data. Statistical significance was set at p-value ≤ 0.05.

