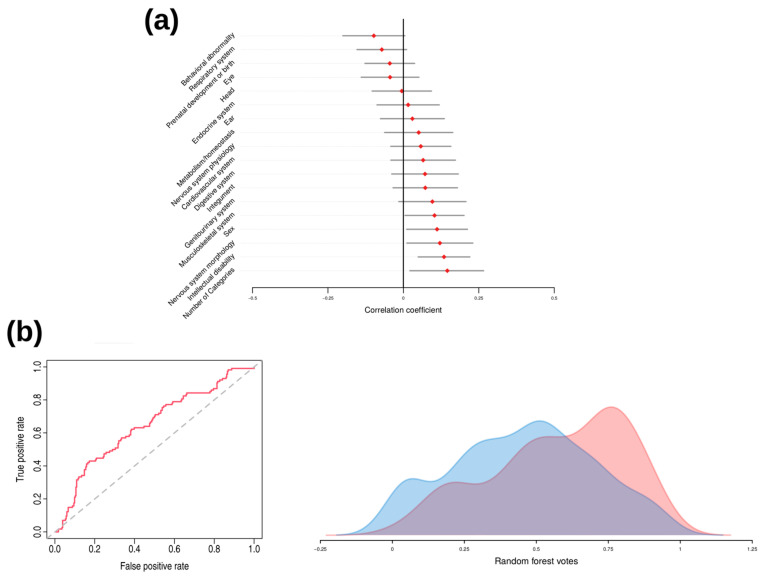
Figure 1.
Association of phenotypic variables with the presence of pathogenic variants and random forest analysis results. (a) Correlation coefficients and corresponding 95% confidence intervals for the phenotypic variables described in Section 2.1. The Glass rank biserial correlation coefficient was obtained for the variable “Number of categories”, while for all the remaining variables, the ϕ correlation coefficient was computed. (b) Receiver operating curve (ROC) and area under the curve (AUC) for the prediction model in the random forest analysis (left). On the right are represented the distributions of random forest votes between patients with identified pathogenic variant (red) and the rest (blue).

