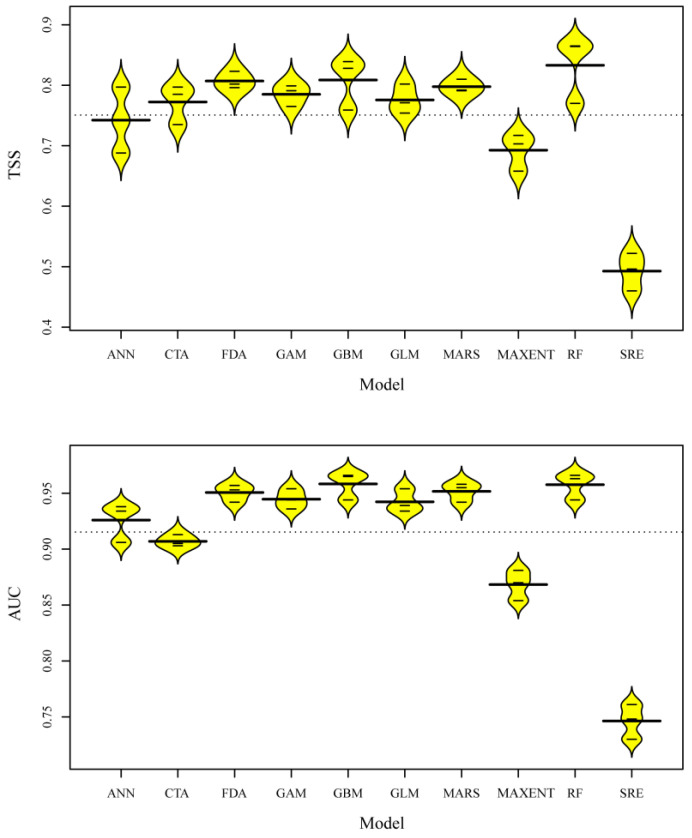
Figure 2.
Beanplot illustrating performance in terms of TSS and AUC values over the 30 predictive models (10 algorithms × 3 runs). The bold horizontal lines indicate the overall average values for each algorithm. GLM, general linear model; GBM, general boosted model; GAM, general additive model; CTA, classification tree analysis; ANN, artificial neural network; SRE, surface range envelope; FDA, flexible discriminant analysis; MARS, multiple adaptive regression spline; RF, random forest; MAXENT, maximum entropy.

