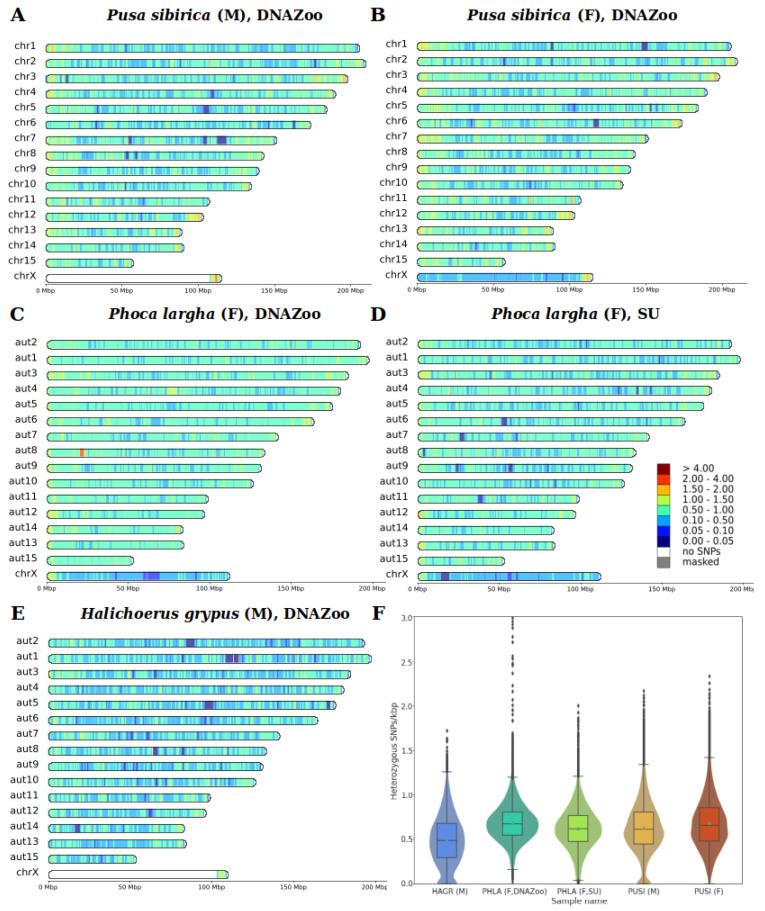
Figure 3.
Heterozygous SNP densities (SNPs/kbp) for analyzed samples of three pinniped species. HetSNPs were counted in 1 Mbp sliding windows, with a 100 kbp step size, and scaled to SNPs/kbp. (A) PSIB, male, (B) PSIB, female, (C) HGRY, male, DNA Zoo, (D) PLAR, female, DNA Zoo, (E) PLAR, female, Seoul University, (F) violin and boxplots of heterozygosity distribution for all five pinniped samples. Autosomes of PLAR and HGRY were arranged according to their correspondence to PSIB and PVIT chromosomes.

