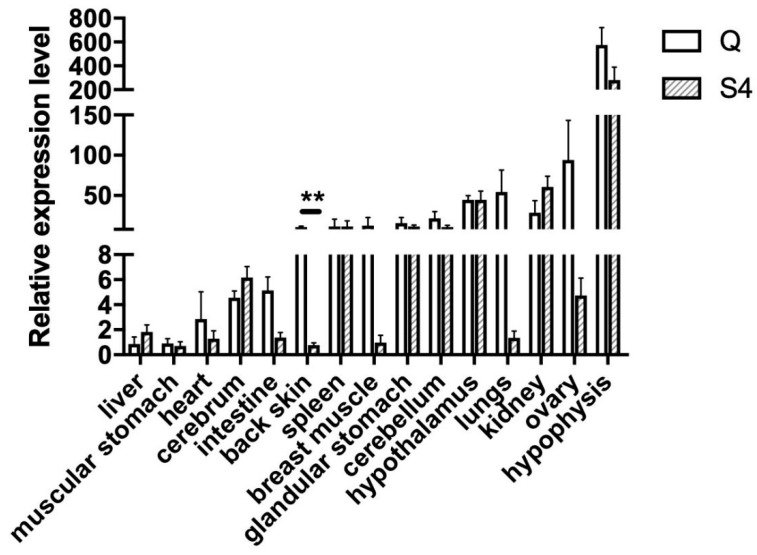
Figure 2.
BCO2 expression level in different chicken tissues in the Qingjiao Ma (Q) and Guangxi Huang (S4) chicken breeds. Relative expression analyses in 15 tissue samples of BCO2 gene were normalized to the geometric average of ACTB (β-actin) and GAPDH genes. Error bars represent the SE, and ** indicates significant differences between different breeds for the same tissue (p ≤ 0.01).

