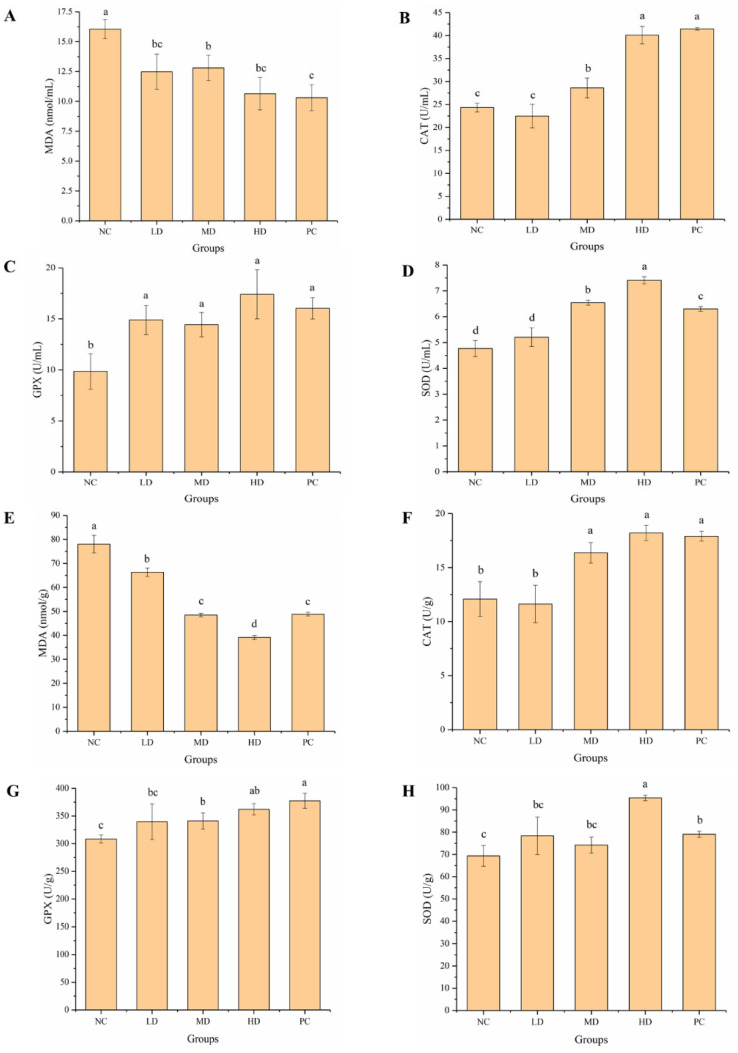
Figure 7.
Effect of HGP on serum and brain antioxidant levels in mice. (A) Malondialdehyde (MDA) in serum of mice from different groups. (B) Catalase (CAT) in serum of mice from different groups. (C) Glutathione peroxidase (GPX) in serum of mice from different groups. (D) Superoxide dismutase (SOD) in serum of mice from different groups. (E) MDA in brains of mice from different groups. (F) CAT in brains of mice from different groups. (G) GPX in brains of mice from different groups. (H) SOD in brains of mice from different groups. Different lowercase letters represent significant differences between groups (p < 0.05). NC: normal control, LD: low dose, MD: middle dose, HD: high dose, PC: positive control.

