Figure 1.
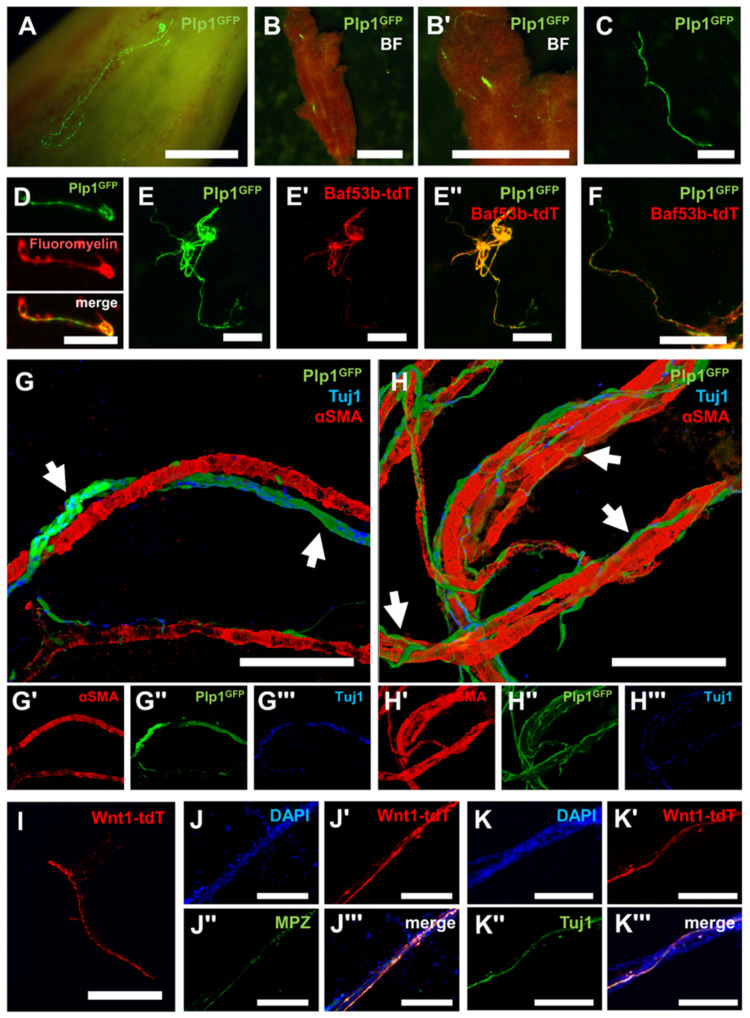
Neural crest-derived Schwann cells reside in the perivascular space of bone marrow in association with nerve fibers. (A) Representative high magnification image of the endosteum of the femur of Plp1GFP+ mice. Scale bar = 1 mm. Representative low (B) and high (B′) magnification images of bone marrow (BM) from Plp1GFP+ mice. Scale bars = 2 mm. (C) Free-floating, fiber-like structure after trituration of BM from Plp1GFP+ mice. Scale bar = 1 mm. (D) FluoroMyelin Red staining of a myelinated Plp1GFP+ nerve fiber from triturated BM. Scale bar = 200 µm. (E–E′′) Representative images of nerve fiber bundles (NFBs) from triturated BM expressing Plp1GFP (E), Baf53b-tdT (E′), and merged image (E′′). Scale bar = 1 mm. (F) High magnification image of the previous demonstrating individual nerve fiber projections. Scale bar 500 µm. (G–G′′′) Representative images of immunocytochemistry of BM from Plp1GFP+ mice with Schwann cells in NFBs (arrows) colocalizing with nerve fibers (Tuj1) in close proximity to arterioles (αSMA) (G), bottom panels show the expression of αSMA (G′), Plp1GFP (G′′), and Tuj1 (G′′′) independently. (H–H′′′) Representative images demonstrating individual Schwann cells intermittently lining nerve fiber projections (arrows) and wrapping tightly around blood vessels, bottom panels show the expression of αSMA (H′), Plp1GFP (H′′), and Tuj1 (H′′′) independently. (G,H) Images are 3D-rendered using ImageJ. Scale bars = 100 µm. (I) Free-floating, fiber-like structure after trituration of BM from Wnt1-tdT+ mice. Scale bar = 1 mm. (J–J′′′) Visualization of DAPI-stained nuclei (J), Wnt1-tdT, (J′), Myelin protein zero (MPZ) (J′′), and merged image (J′′′) in NFBs isolated from the BM. (K–K′′′) Visualization of DAPI-stained nuclei (K), Wnt1-tdT (K′), Tuj1 (K′′), and merged image (K′′′) in NFBs isolated from the BM. (J,K) Scale bars = 200 µm.

