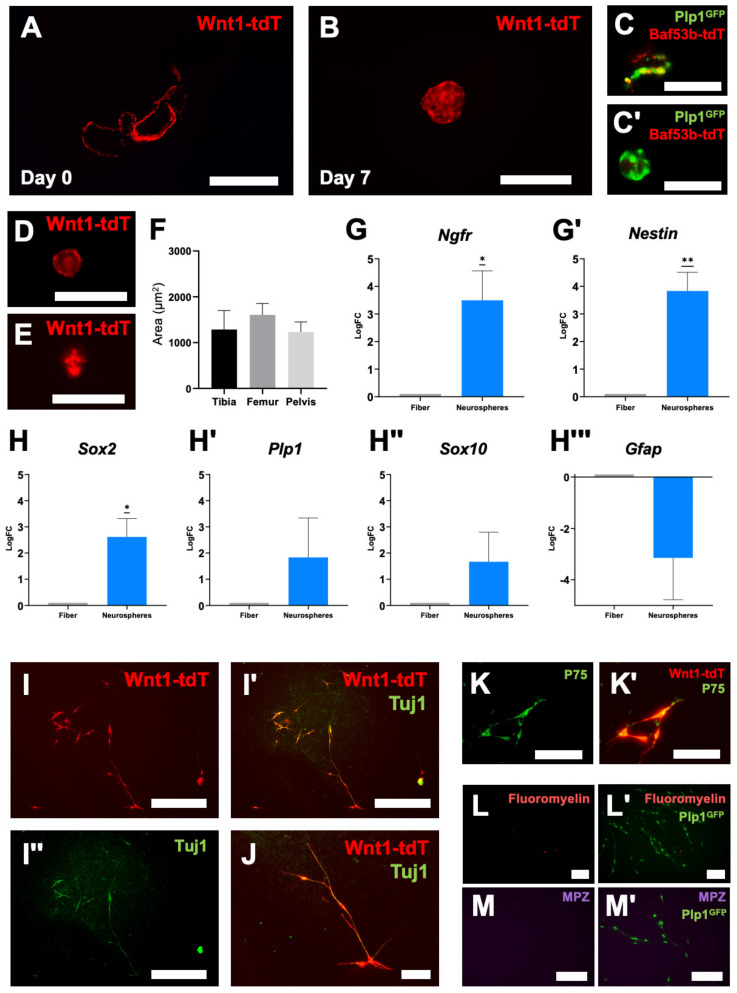
Figure 2.
Neural crest-derived Schwann cells from bone marrow develop neural stem cell features in vitro. Expression of Wnt1-tdT in free-floating nerve fibers (A) from BM (day 0) and BM-neural stem cell (BM-NSC) neurospheres (B) in culture (day 7). Scale bars = 1 mm. Expression of Plp1GFP and Baf53b-tdT in free-floating nerve fibers (C) and BM-NSC neurospheres (C′) after 7 days in culture. Scale bars = 100 µm. Representative images of BM-NSC neurospheres generated from the pelvis (D) and tibia (E) of Wnt1-tdT+ mice. Scale bars = 200 µm. (F) Quantification of BM-NSC neurosphere size by source. One-way ANOVA with Welch’s correction (not statistically significant). Tibia, n = 7 independent cultures; Femur, n = 6 independent cultures; Pelvis, n = 3 independent cultures. (G,G′) Quantitative PCR of Ngfr (G) and nestin (G′) gene expression in NFBs and neurospheres. One-sample t-test to LogFC of 0, n = 7, * p < 0.05, ** p < 0.01. (H–H′′′) Quantitative PCR of Sox2 (H), Plp1 (H′), Sox10 (H′′) and Gfap (H′′′) gene expression in NFBs and neurospheres. One-sample t-test to LogFC of 0, * p < 0.05. Sox2 and Plp1, n = 5; Sox10, n = 7; Gfap, n = 6. (I–I′′) Representative images of Wnt1-tdT+ BM-NSCs cultured on fibronectin in monolayer conditions (I), merged images with Tuj1 expression (I′), and Tuj1 expression shown independently (I′′). Scale bar = 500 µm. (J) High magnification image of the above. Scale bar = 100 µm. (K,K′) Expression of P75 (K) in Wnt1-tdT+ BM-NSCs (K′). Scale bar = 50 µm. (L–M′) Representative images of FluoroMyelin (L) and MPZ expression (M) in Plp1GFP expressing BM-NSCs (L′,M′). Scale bars = 200 µm.

