Figure 4.
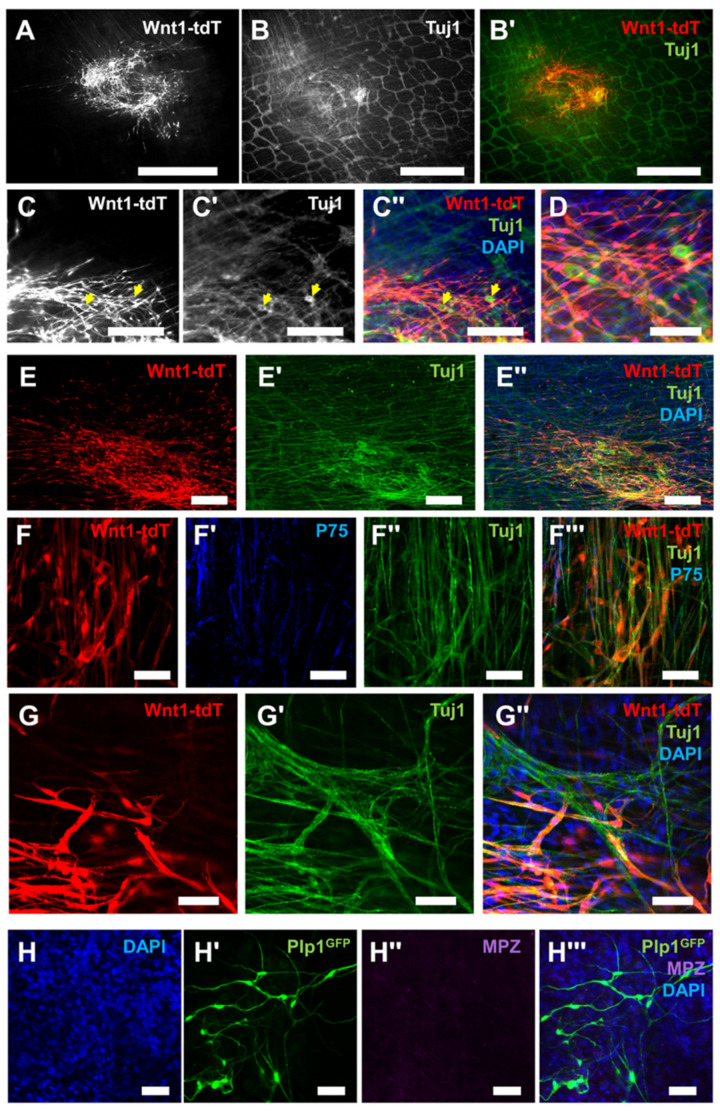
Bone marrow neural stem cells migrate, differentiate into neurons, and engraft with the enteric nervous system after in vivo transplantation. (A) Representative image of Wnt1-tdT+ BM-NSC migration and cell spread in the mid-colon at 8 weeks post-implantation. Scale bar = 1 mm. (B,B′) Images of whole-mount preparations of recipient longitudinal muscle myenteric plexus (LMMP) with Tuj1 (B) expression in transplanted Wnt1-tdT+ NSCs (B′). Scale bar = 1 mm. (C–C′′) Representative images of transplanted Wnt1-tdT+ NSCs (C), Tuj1 expression (C′), and merged image (C′′) in whole-mount preparations. Yellow arrows indicate Tuj1+ neuronal soma derived from BM-NSCs. Scale bar = 250 µm. (D) High magnification image of the above. Scale bar = 100. (E–E′′) Representative images of the colorectum whole-mount preparations at 3 weeks post-transplantation containing Wnt1-tdT+ BM-NSCs (E), Tuj1 expression (E′), and merged image containing DAPI-stained nuclei (E”). Scale bar = 200 µm. (F–F′′) Images of Wnt1-tdT+ BM-NSCs (F) forming interconnected clusters of cells similar to ganglia, expressing P75 (F′), Tuj1 (F′′), and merged image (F′′′). Scale bar = 50 µm. (G–G″) Images at the periphery of the implantation site showing Wnt1-tdT+ BM-NSCs (G), expression of Tuj1 (G′), and merged image including DAPI-stained nuclei (G″). Wnt1-tdT+ BM-NSCs co-expressed Tuj1 and form connections with, and incorporate into, the host ENS. Scale bar = 50 µm. (H–H′′′) Representative images of DAPI-stained nuclei (H), transplanted Plp1GFP+ BM-NSCs (H′), MPZ expression (H′′), and merged image (H′′′) depicting that BM-NSCs do not regain the expression of the myelinating Schwann cell protein MPZ after transplantation to the gut. Scale bar = 50 µm.

