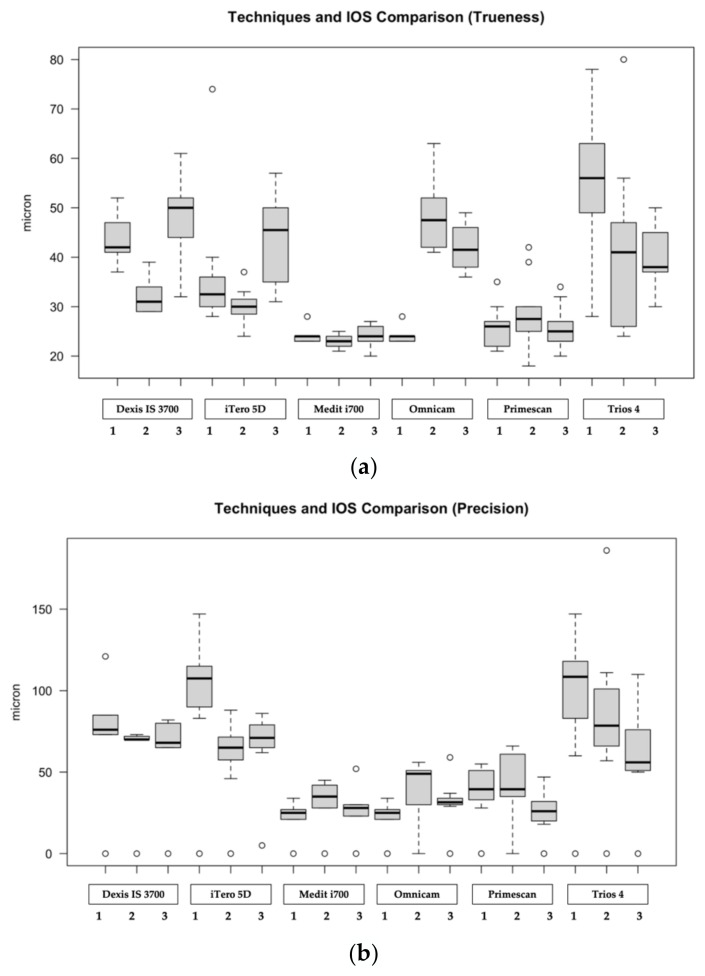
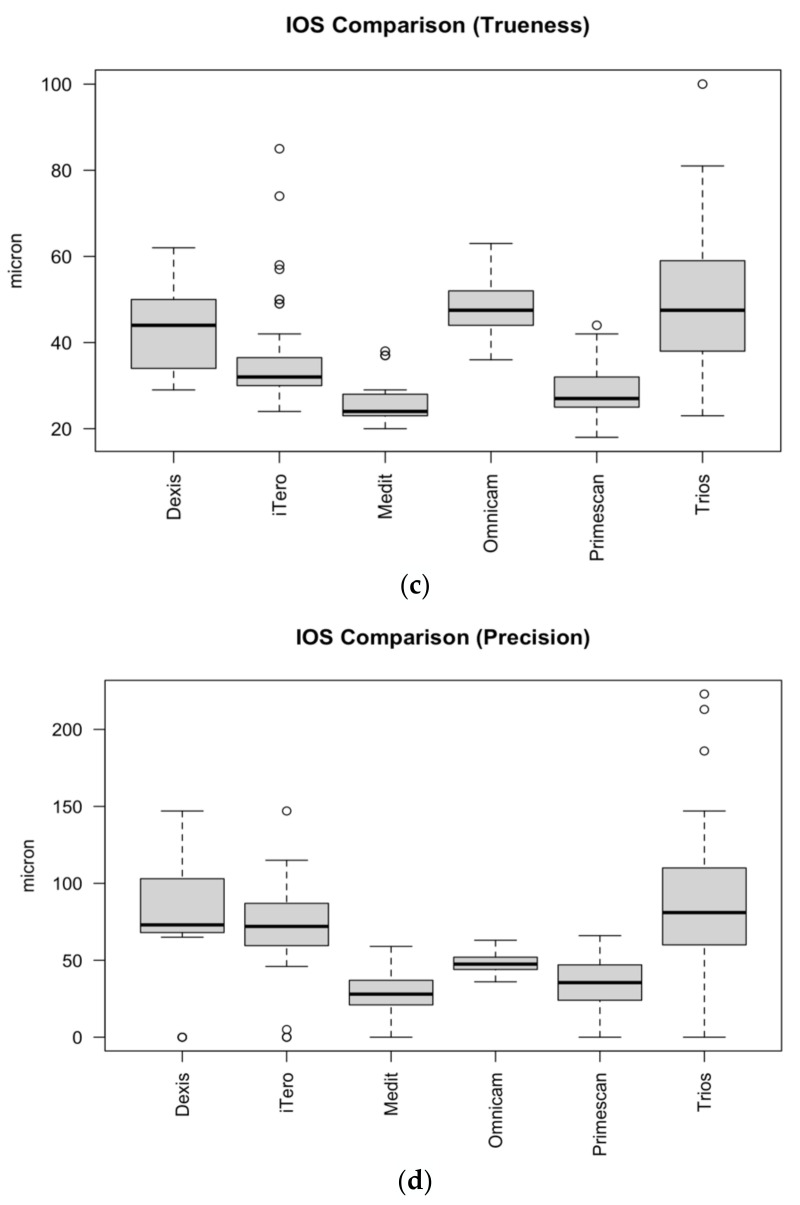
Figure 5.
Graphical representation of the results of IOSs according to the studied scanning strategies: (a) Boxplot referring to trueness; (b) Boxplot referring to precision; (c) trueness related pooled data according to the studied IOSs; (d) precision related pooled data according to the studied IOSs. Data are based on a five number summary (“minimum” value, first quartile [Q1], median, third quartile [Q3] and “maximum” value).


