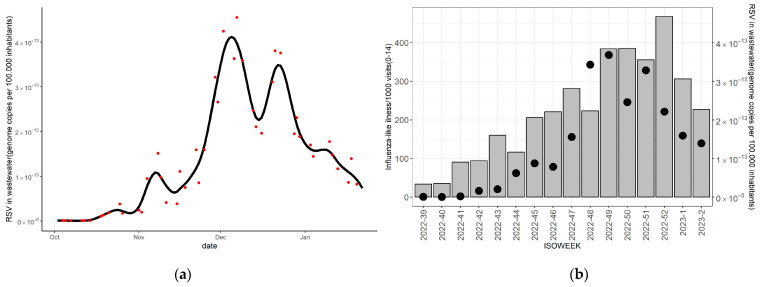
Figure 1.
Respiratory syncytial virus wastewater viral load and weekly influenza-like illness (ILI) per 1000 visits in Larissa during the study period. Notes: (a) presents the RSV load in wastewater expressed as genome copies per 100,000 inhabitants in the municipality of Larissa (1 October 2022–15 October 2023). Viral load: RNA concentration (Genome copies/L) × Wastewater flow(m3/day) × 108/population served by the wastewater treatment plant (WWTP). Red dots represent the viral load corresponding to the date the sample was taken. The Fit curve was generated by spline smoothing. (b) presents weekly influenza-like illness (ILI) per 1000 visits from Larissa, in the age group 0–14 years (bars correspond to the left axis). Dots represent the average RSV load for each ISO week and correspond to the right axis.

