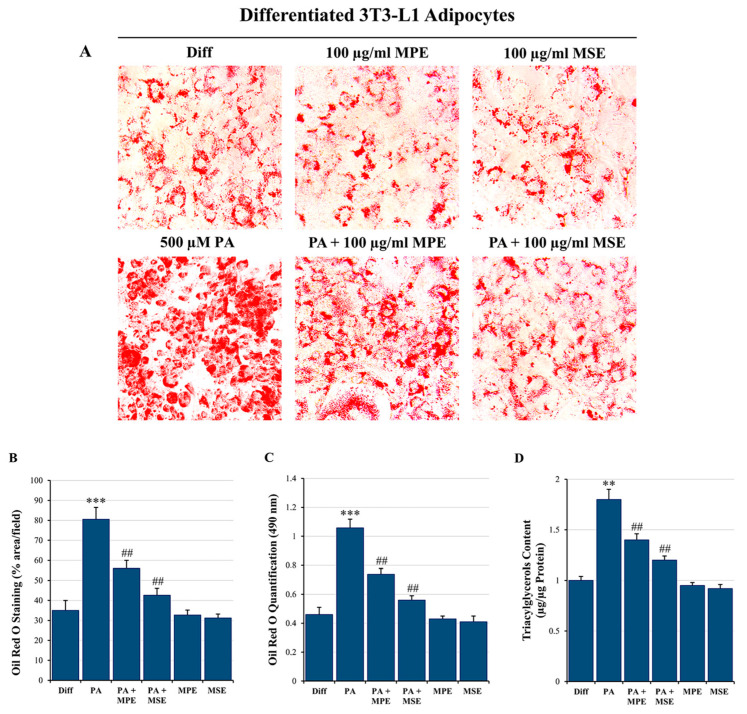
Figure 3.
MPE and MSE reduce 3T3-L1 adipocyte hypertrophy induced by high concentrations of PA. 3T3-L1 differentiated adipocytes were treated for 48 h with 500 µM PA alone or in the presence of 100 µg/mL MPE or MSE. (A) Representative Oil red O staining microscopy images showing the increase in LDs after treatment with 500 µM PA alone and their reduction when 100 μg/mL MPE or MSE was added (200× original magnification). (B) LD content was ascertained by analyzing the percentage area of Oil Red O stained by ImageJ. (C) Quantitative Oil red O staining was measured by a spectrophotometer at 490 nm. (D) Cellular TAG content was quantified by spectrophotometer at 546 nm. The results are the mean of three independent experiments ± SD. The statistical differences between groups were evaluated using a one-way ANOVA test. ** p < 0.01 and *** p < 0.001 were significant with respect to differentiated 3T3-L1 adipocytes and ## p < 0.01 with respect to PA-treated 3T3-L1 adipocytes.

