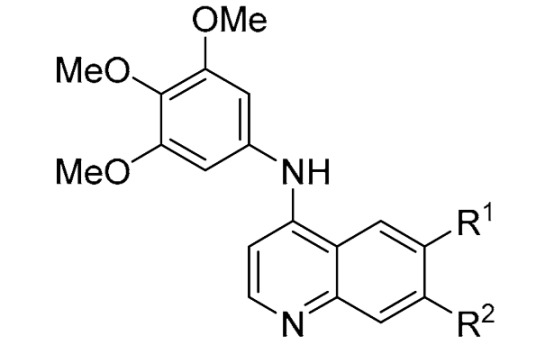
Table 6.
Toxicity profiling of 3,4,5-trimethoxyaniline analogs containing a quinoline scaffold (63–80) a,b,c.

|
|||||||||||
|---|---|---|---|---|---|---|---|---|---|---|---|
| Name | R1 | R2 | CM | CMI | ROS | GSH | NMI1 | CC | NMI2 | MMP | CHI |
| Erlotinib | - | 0.77 | 0.50 | 0.13 | 0.63 | 0.10 | 0.10 | 0.062 | 0.12 | 0.40 | |
| 63 | OMe | OMe | 1.00 | 1.00 | 1.00 | 1.00 | 0.99 | 0.99 | 0.98 | 1.00 | 0.92 |
| 64 | H | OMe | 0.85 | 0.038 | 0.56 | 0.35 | 0.33 | 0.070 | 0.024 | 0.089 | 0.32 |
| 65 | OMe | H | 0.91 | 0.87 | 0.15 | 0.87 | 0.92 | 0.95 | 0.57 | 0.49 | 0.56 |
| 66 | H | H | 0.18 | 0.32 | 0.022 | 0.29 | 0.20 | 0.68 | 0.0053 | 0.022 | 0.32 |
| 67 | F | H | 0.011 | 0.13 | 0.052 | 0.28 | 0.094 | 0.26 | 0.051 | 0.034 | 0.27 |
| 68 | F | F | 0.036 | 0.048 | 0.25 | 0.24 | 0.12 | 0.16 | 0.025 | 0.088 | 0.29 |
| 69 | Cl | H | 0.59 | 0.89 | 0.098 | 0.60 | 0.46 | 0.37 | 0.13 | 0.059 | 0.38 |
| 70 | Br | H | 0.87 | 0.69 | 0.25 | 0.26 | 0.62 | 0.71 | 0.77 | 0.33 | 0.46 |
| 71 | I | H | 0.97 | 0.97 | 0.94 | 0.92 | 0.76 | 0.98 | 0.89 | 0.91 | 0.67 |
| 72 | CF3 | H | 0.89 | 0.78 | 0.063 | 0.096 | 0.24 | 0.50 | 0.064 | 0.078 | 0.37 |
| 73 | CN | H | 0.079 | 0.006 | 0.055 | 0.047 | 0.23 | 0.18 | 0.066 | 0.045 | 0.22 |
| 74 | SO2Me | H | 0.096 | 0.072 | 0.23 | 0.10 | 0.53 | 0.36 | 0.051 | 0.14 | 0.25 |
| 75 | H | F | 0.010 | 0.15 | 0.31 | 0.020 | 0.13 | 0.045 | 0.005 | 0.060 | 0.21 |
| 76 | H | Cl | 0.81 | 0.98 | 0.95 | 0.97 | 0.71 | 0.88 | 0.566 | 0.94 | 0.63 |
| 77 | H | Br | 0.28 | 0.12 | 0.11 | 0.15 | 0.28 | 0.052 | 0.045 | 0.021 | 0.27 |
| 78 | H | I | 0.097 | 0.11 | 0.18 | 0.18 | 0.22 | 0.51 | 0.024 | 0.15 | 0.35 |
| 79 | H | CF3 | 0.29 | 0.078 | 0.27 | 0.21 | 0.05 | 0.18 | 0.0050 | 0.33 | 0.30 |
| 80 | H | CN | 0.010 | 0.035 | 0.12 | 0.027 | 0.76 | 0.026 | 0.0092 | 0.018 | 0.22 |
a Abbreviations from columns left to right. CM: Cell morphology; CMI: Cell membrane integrity; ROS: Reactive oxygen species; GSH: Glutathione; NMI1: Nuclear membrane integrity 1; CC: Cell Cycle; NMI2: Nuclear membrane integrity 2; MMP: Mitochondrial membrane potential; CHI: Cell Health Index. b Traffic light colouring matching classifier values (Red–Green: high toxicity risk–low toxicity risk). c all n = 2.
