Figure 1.
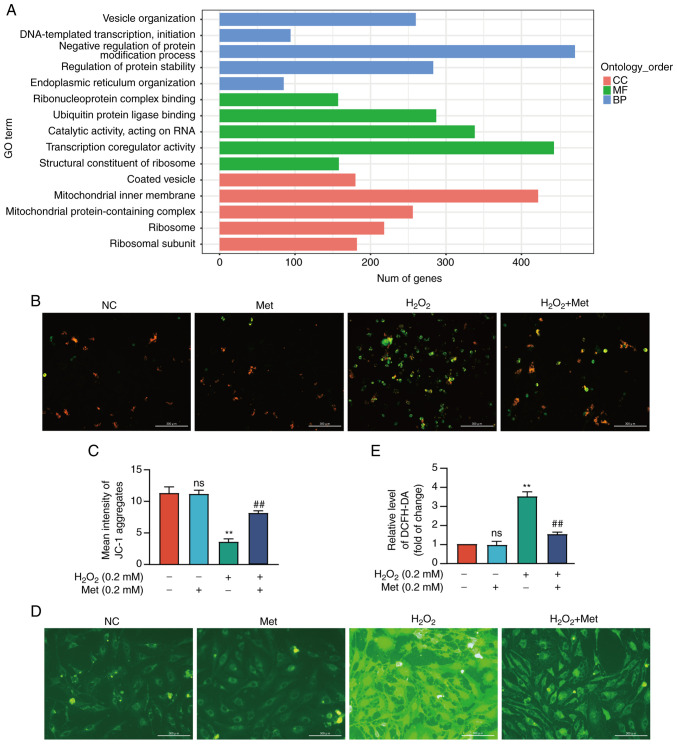
Metformin reverses pre-osteoblast mitochondrial apoptosis by attenuating mitochondrial permeability transition pore opening. (A) Metformin in the process of cytological components, molecular biological functions and biological processes through GO analysis. (B) The number of JC-1 monomers and JC-1 aggregates in MC3T3-E1 cells with or without metformin treatment was observed. (C) The fluorescence intensity of JC-1 aggregates was detected using a full-wavelength multifunctional microplate reader. The fluorescence intensity decreased in the H2O2 group, and metformin group reversed this process. (D) The intracellular ROS level was observed using a fluorescence electron microscope. (E) The average fluorescence intensity was detected using flow cytometry. ROS generation increased in H2O2 group and decreased in the metformin group. The experiment was conducted three times. The data are expressed as the mean ± SD. **P<0.01, compared with the control cells; ##P<0.01, compared with the H2O2 group. ns, not significant; GO, Gene Ontology; CC, cellular component; MF, molecular function; BP, biological process; ROS, reactive oxygen species; Met, metformin; H2O2, hydrogen peroxide.

