Figure 1.
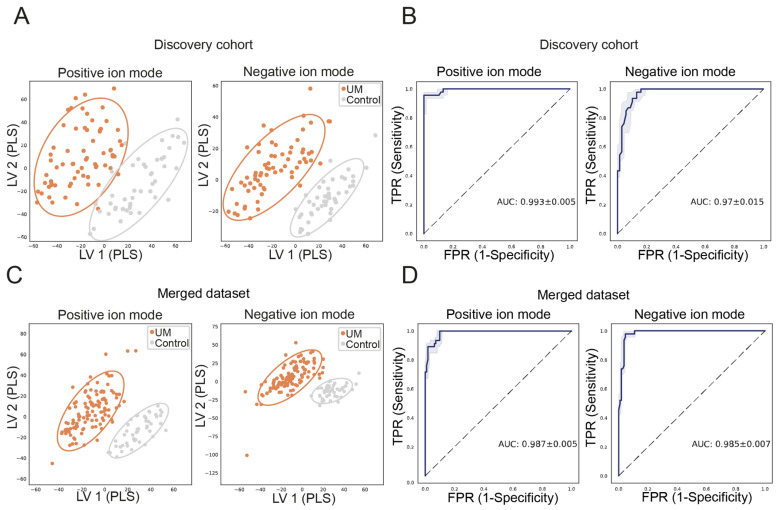
Distinct metabolite patterns in UM patients can be used for differentiation. Mass/charge features (with distinct retention times) were determined using ultra-high performance liquid chromatography mass spectrometry, and these features were used for supervised dimensionality reduction methods and to train a random forest classifier (RFC). The partial least squares determinant analysis shows separation of UM samples compared to samples of controls in the positive and negative ion modes, in the discovery cohort (A) and merged dataset (C), in which UM patients are depicted in orange and controls are shown in gray and the circles represent the 95% confidence interval. We have trained an RFC on the metabolite patterns derived from UM patients and controls. The blue fitted line is the receiver operating characteristic (ROC) curve that represents the performance of our RFC model, as evaluated using the leave-one-out cross-validation procedure, by sensitivity on the Y-axis and 1-specificity on the X-axis for the discovery cohort (B) and merged dataset, respectively (D) with a 25–75% interval depicted in grey. The overall test performance is shown by area under the curve (AUC), and an AUC greater than 0.7 is generally considered a threshold for fair performance whereas an AUC of 1 indicates a perfect performance. The AUC of our test in the discovery cohort is 0.99 and 0.97 in the positive and negative ion modes, respectively, which means a near-perfect ability to differentiate metabolite patterns of UM patients compared to controls. The AUC of 0.99 and 0.99 for the positive and negative ion modes in the merged dataset indicate a robust differentiating power of our test when samples are added.

