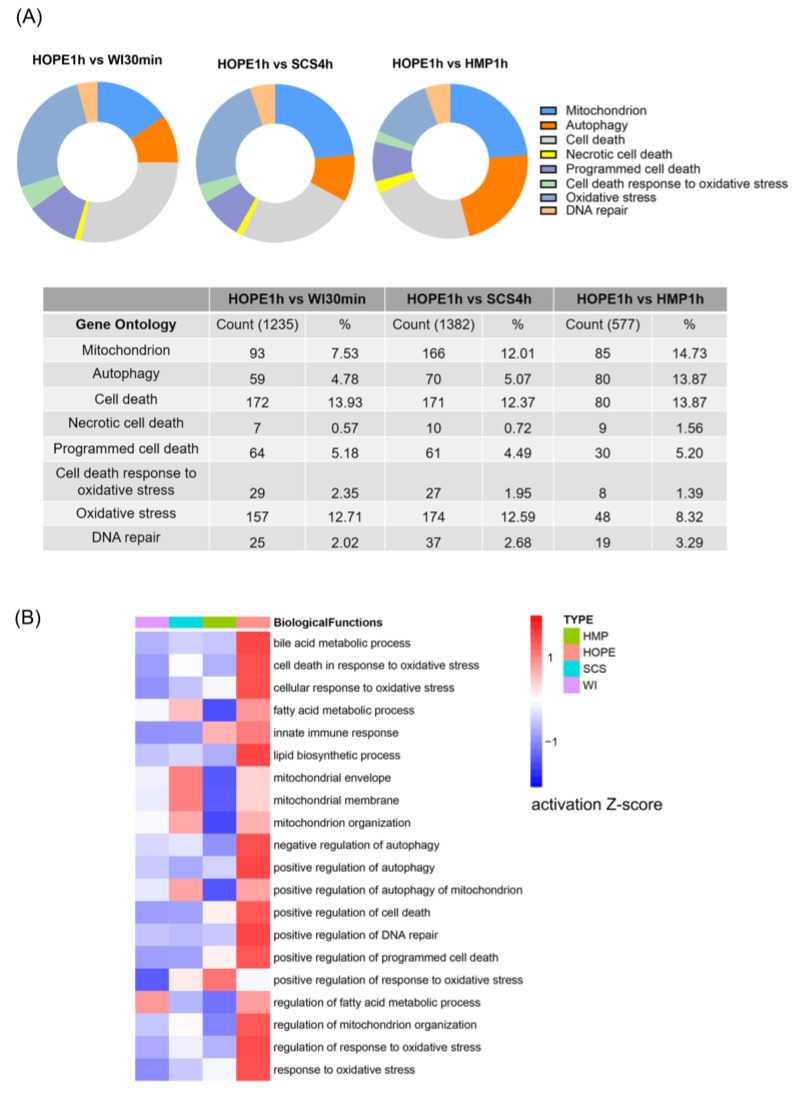
Figure 3.
HOPE-regulated transcriptomic gene in DCD liver targeted mitochondrial bioenergetics, autophagy, and cell death. (A) The pie chart represents the most common gene ontology clusters that were altered in response to hypoxia-ischemic injury; tables represent the percentile change in gene ontology from the total genes in the array. (B) Heat map comparison analysis shows changes in gene expression related to a variety of biological functions across observations in multiple datasets. The 20 rows (biological function) with the highest total absolute z-scores across the set of observations were sorted. Four columns designate gene expression signatures in the four groups: WI 30 min, SCS 4 h, HMP 1 h, and HOPE 1 h. The activation z-scores for biological functions are displayed using a gradient from dark blue to red for activation z-scores. (n = 3).

